. 2021 Feb;24(2):204-213.
doi: 10.1038/s41593-020-00762-9. Epub 2020 Dec 23.

Maternal immune activation in mice disrupts proteostasis in the fetal brain

Affiliations

Maternal immune activation in mice disrupts proteostasis in the fetal brain

Brian T Kalish et al. Nat Neurosci. 2021 Feb.

Abstract

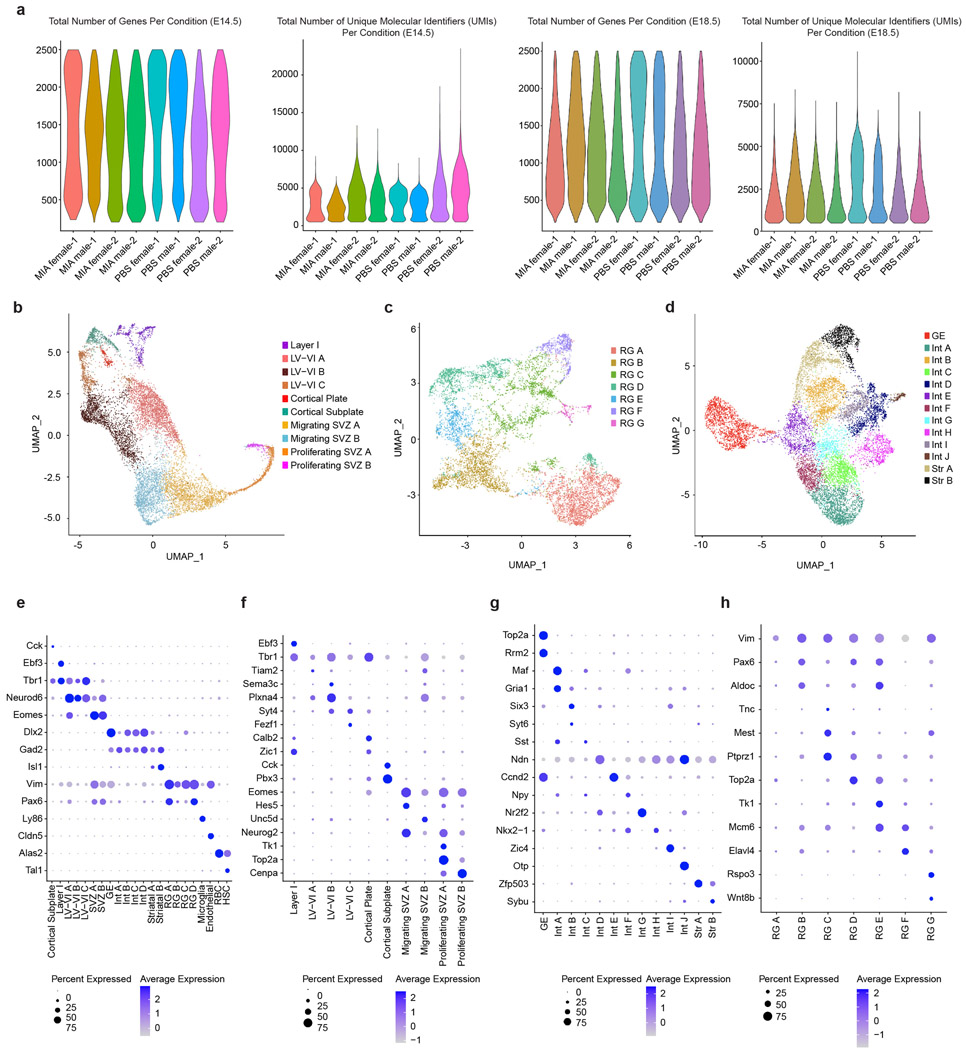
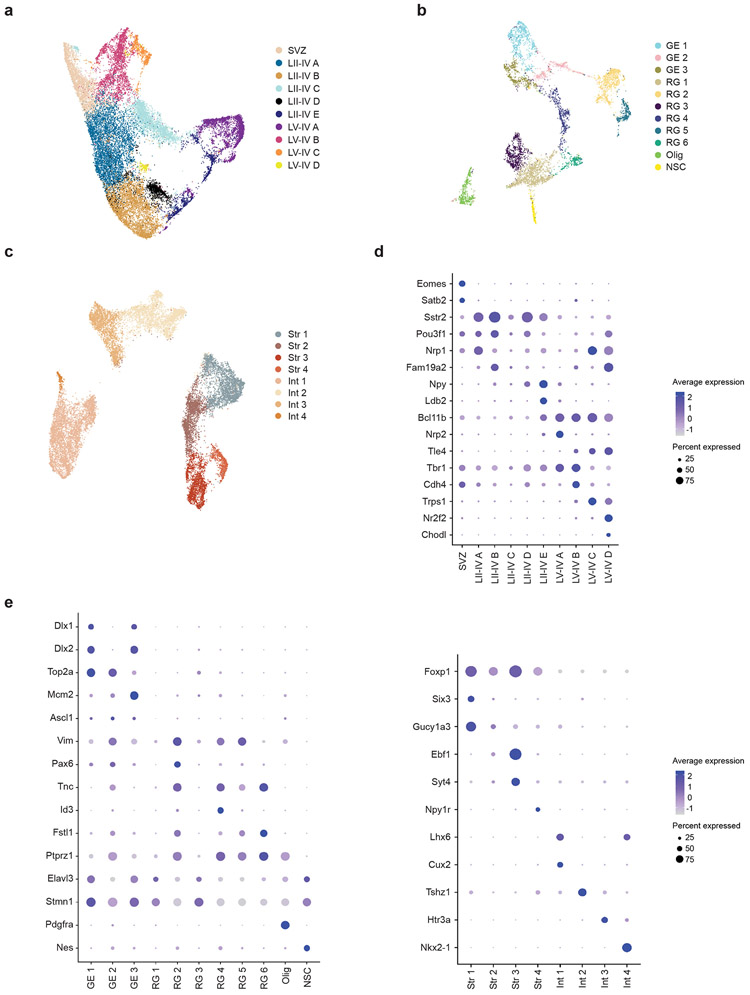
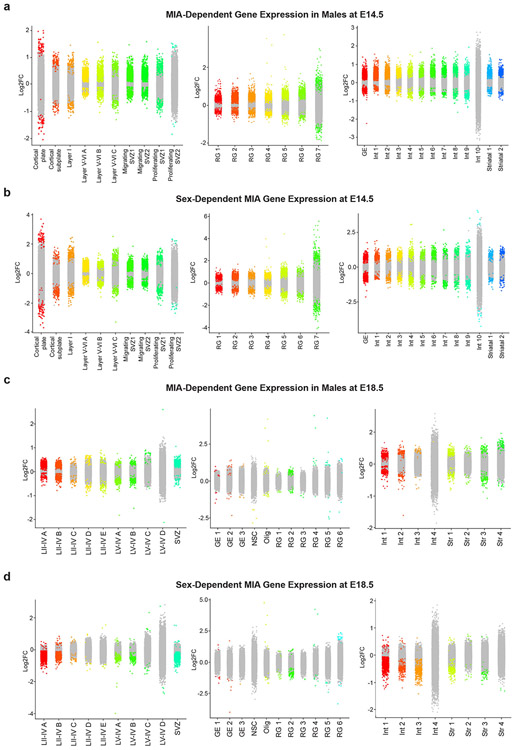
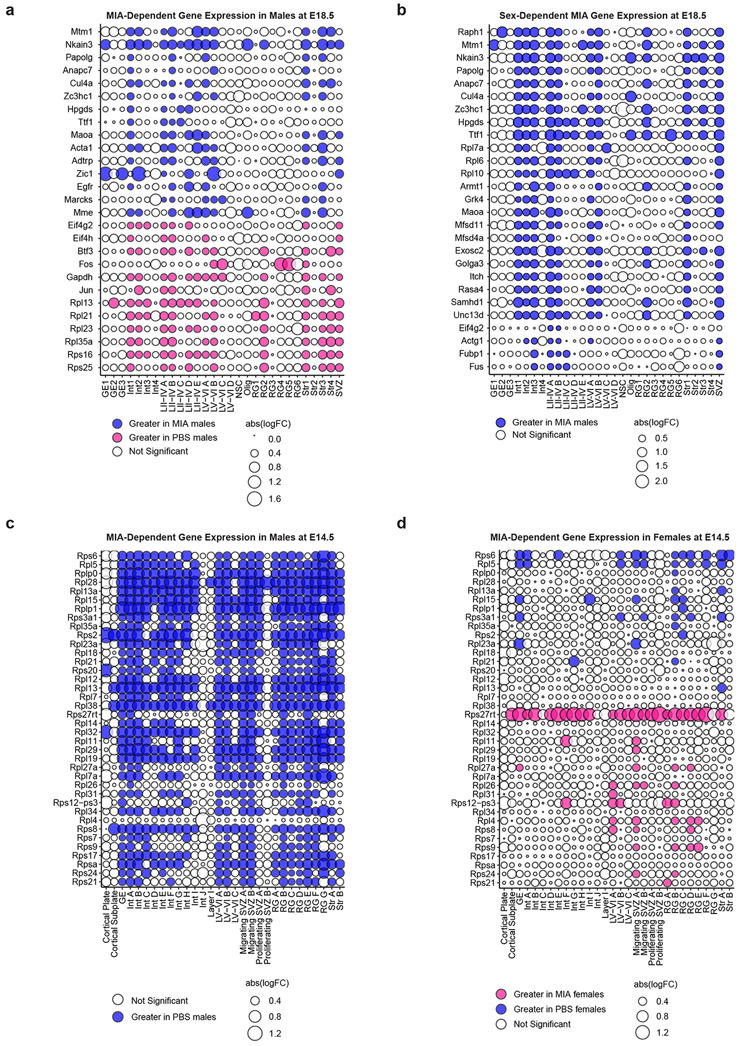
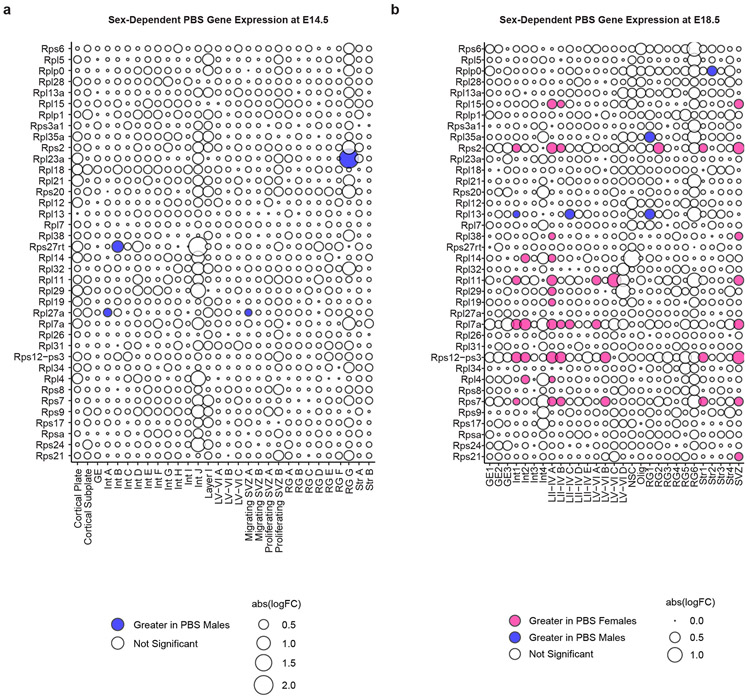
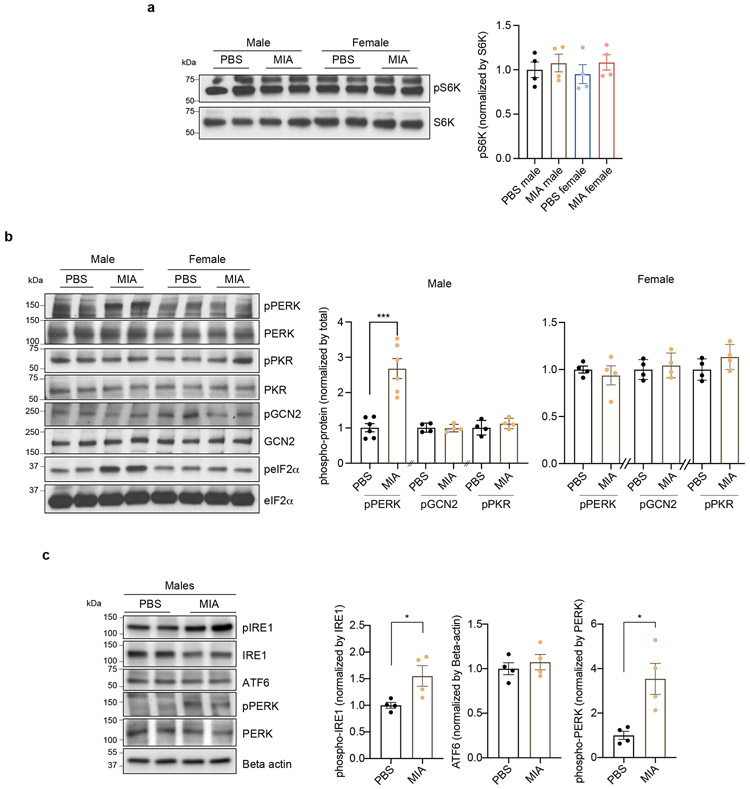
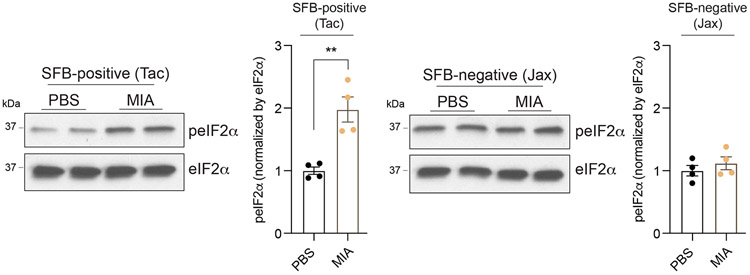
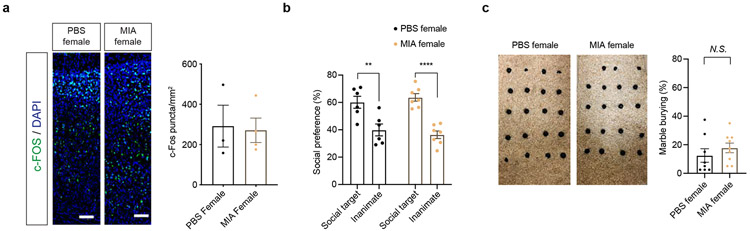
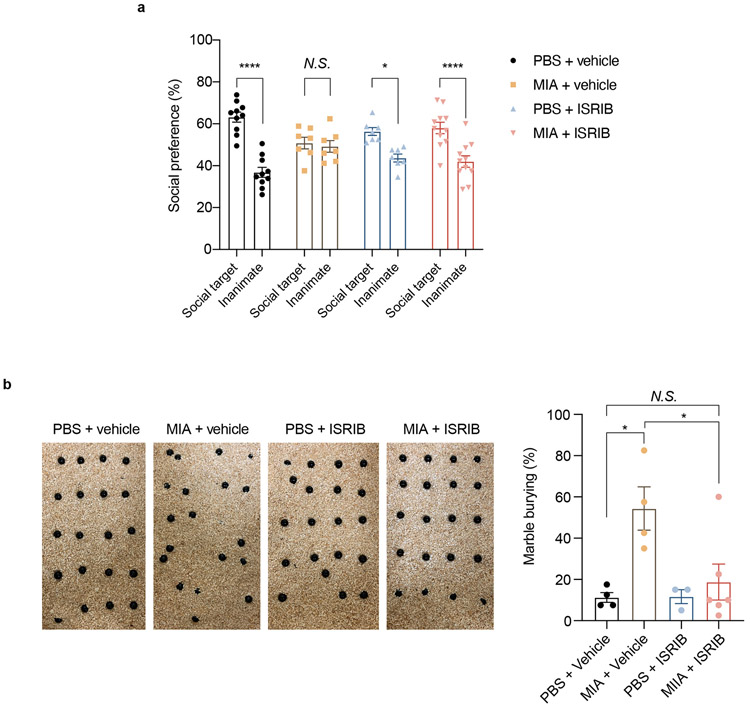
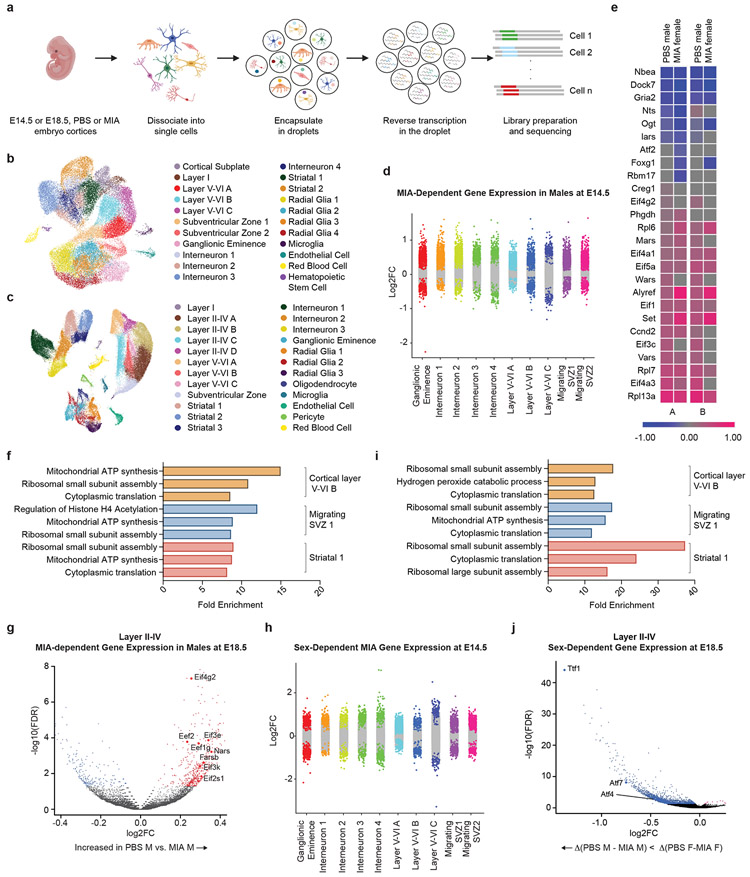
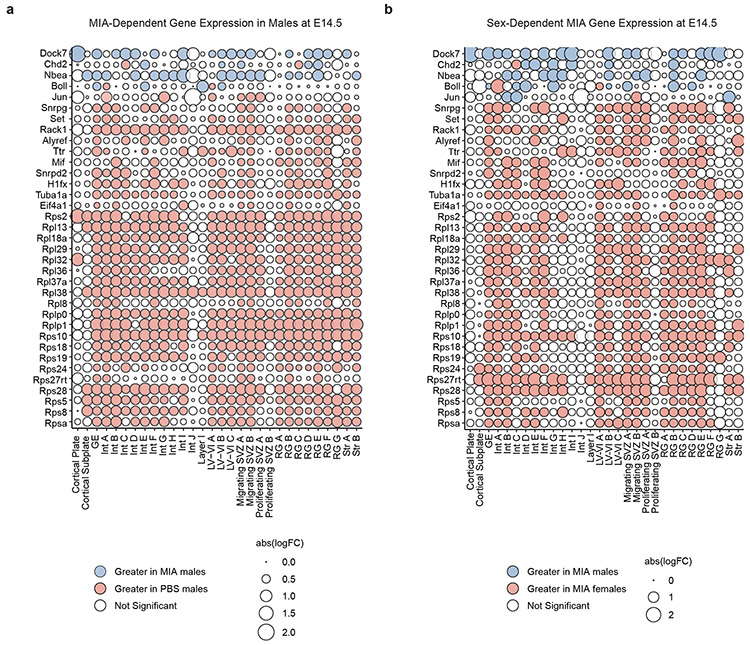
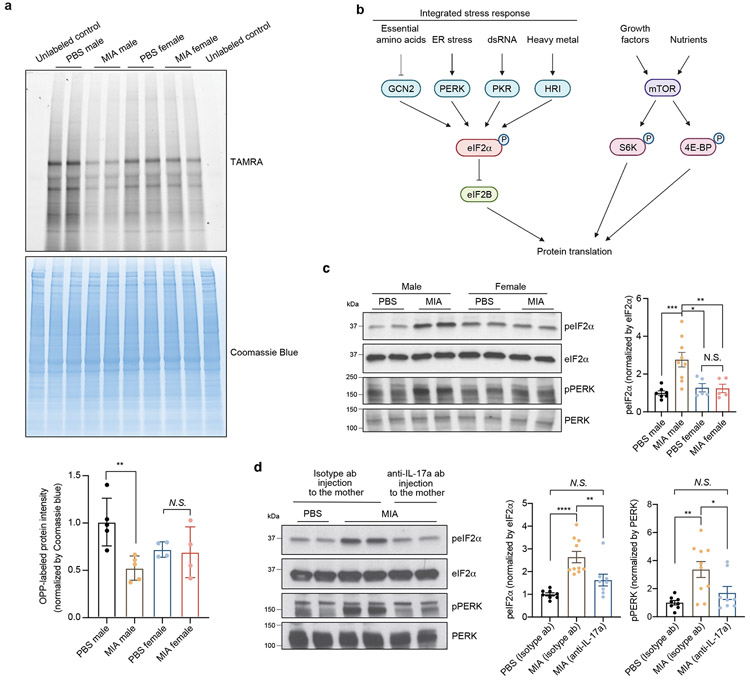
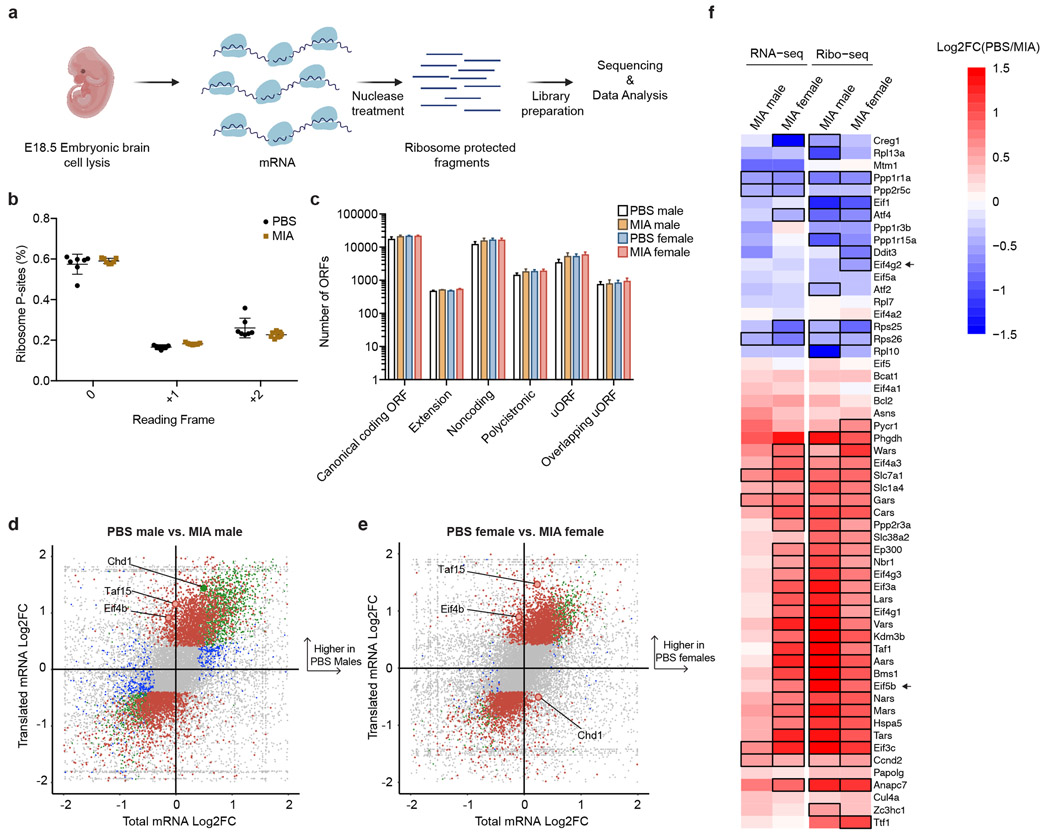
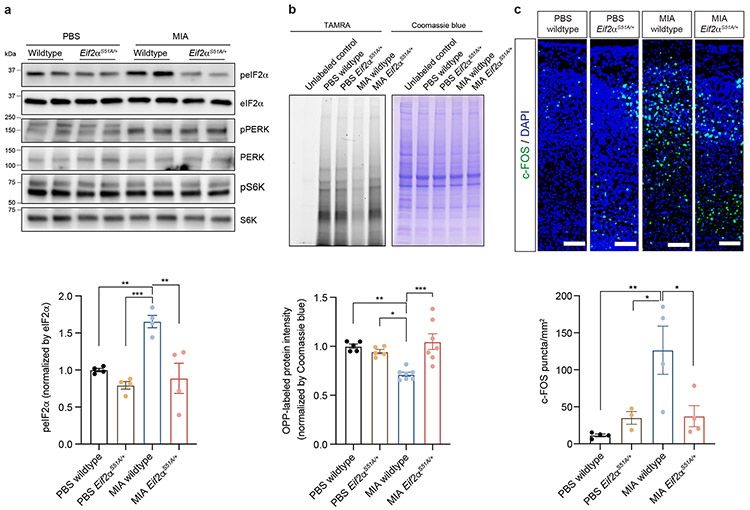
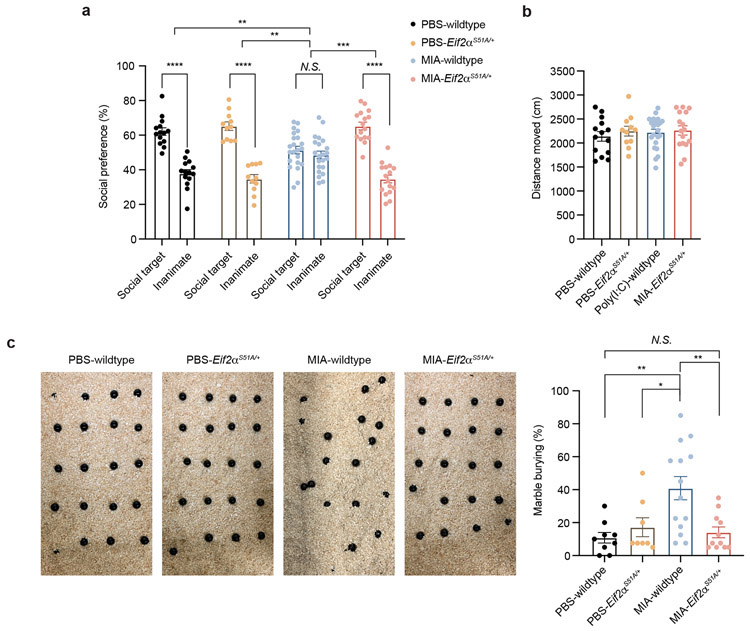
Maternal infection and inflammation during pregnancy are associated with neurodevelopmental disorders in offspring, but little is understood about the molecular mechanisms underlying this epidemiologic phenomenon. Here, we leveraged single-cell RNA sequencing to profile transcriptional changes in the mouse fetal brain in response to maternal immune activation (MIA) and identified perturbations in cellular pathways associated with mRNA translation, ribosome biogenesis and stress signaling. We found that MIA activates the integrated stress response (ISR) in male, but not female, MIA offspring in an interleukin-17a-dependent manner, which reduced global mRNA translation and altered nascent proteome synthesis. Moreover, blockade of ISR activation prevented the behavioral abnormalities as well as increased cortical neural activity in MIA male offspring. Our data suggest that sex-specific activation of the ISR leads to maternal inflammation-associated neurodevelopmental disorders.


Conflict of interest statement

COMPETING INTERESTS STATEMENT

The authors do not report any conflicts of interest related to the content of this work.

Figures

Extended Data Fig. 1
Extended Data Fig. 1. Quality Control and E14.5 Sub-clustering
a, Total number of genes per condition and total number of unique molecular identifiers (UMIs) per condition in the final E14.5 and E18.5 single cell sequencing datasets. Data from n = 2 mice per group. b, UMAP of sub-clustering of mature and immature (SVZ, cortical plate, cortical subplate) neurons at E14.5. Data from n = 2 mice per group. c, UMAP of sub-clustering of radial glia (RG) at E14.5. Data from n = 2 mice per group. d, UMAP of sub-clustering of interneurons (Int), ganglionic eminence (GE), and striatal neurons at E14.5. Data from n = 2 mice per group. e, Dot plot of marker genes associated with all cells at E14.5. Data from n = 2 mice per group. f, Dot plot of marker genes associated with the cells in (b): mature and immature (SVZ, cortical plate, cortical subplate) neurons at E14.5. Data from n = 2 mice per group. g, Dot plot of marker genes associated with the cells in (d): interneurons (Int), ganglionic eminence (GE), and striatal neurons at E14.5. Data from n = 2 mice per group. h, Dot plot of marker genes associated with the cells in (c): radial glia (RG) at E14.5. Data from n = 2 mice per group.
Extended Data Fig. 2
Extended Data Fig. 2. E18.5 sub-clustering
a, UMAP of sub-clustering of mature and immature (SVZ) neurons at E18.5. Data from n = 2 mice per group. b, UMAP of sub-clustering of radial glia (RG), ganglionic eminence (GE), oligodendrocytes (Olig), and neural stem cells (NSC) at E18.5. Data from n = 2 mice per group. c, UMAP of sub-clustering of striatal neurons (Str) and interneurons (Int) at E18.5. Data from n = 2 mice per group. d, Dot plot of marker genes associated with cells in (a): mature and immature (SVZ) neurons at E18.5. Data from n = 2 mice per group. e, (left) Dot plot of marker genes associated with cells in (b): radial glia (RG), ganglionic eminence (GE), oligodendrocytes (Olig), and neural stem cells (NSC) at E18.5; and (right) Dot plot of marker genes associated with cells in (c): striatal neurons (Str) and interneurons (Int) at E18.5. Data from n = 2 mice per group.
Extended Data Fig. 3
Extended Data Fig. 3. Differential gene expression strip plots
a, Strip plot displaying differential gene expression between MIA male offspring and PBS male offspring at E14.5. Colored dots represent significant genes (FDR < 0.05). X-axis displays select cortical cell types. Cell groups (left to right): (1) mature and immature (SVZ, cortical plate, cortical subplate) neurons, (2) radial glia (RG), and (3) interneurons (Int), ganglionic eminence (GE), and striatal neurons. Data from n = 2 mice per group. b, Strip plot displaying sex-dependent gene expression in MIA offspring at E14.5. Colored dots represent significant genes (FDR < 0.05). X-axis displays select cortical cell types. Cell groups (left to right): (1) mature and immature (SVZ, cortical plate, cortical subplate) neurons, (2) radial glia (RG), and (3) interneurons (Int), ganglionic eminence (GE), and striatal neurons. Data from n = 2 mice per group. c, Strip plot displaying differential gene expression between MIA male offspring and PBS male offspring at E18.5. Colored dots represent significant genes (FDR < 0.05). X-axis displays select cortical cell types. Cell groups (left to right): (1) mature and immature (SVZ) neurons, (2) radial glia (RG), ganglionic eminence (GE), oligodendrocytes (Olig), and neural stem cells (NSC), and (3) striatal neurons (Str) and interneurons (Int). Data from n = 2 mice per group. d, Strip plot displaying sex-dependent gene expression in MIA offspring at E18.5. Colored dots represent significant genes (FDR < 0.05). X-axis displays select cortical cell types. Cell groups (left to right): (1) mature and immature (SVZ) neurons, (2) radial glia (RG), ganglionic eminence (GE), oligodendrocytes (Olig), and neural stem cells (NSC), and (3) striatal neurons (Str) and interneurons (Int). Data from n = 2 mice per group.
Extended Data Fig. 4
Extended Data Fig. 4. Single cell differential gene expression changes
a, Bubble plot of highly variable genes between MIA and PBS male offspring at E18.5. All significant genes FDR < 0.05. Blue indicates an increase in MIA males relative to PBS males. Data from n = 2 mice per group. b, Bubble plot of sex-dependent genes in MIA offspring at E18.5. All significant genes FDR < 0.05. Blue indicates an increase in Δ(MIA males – PBS males) relative to females. Data from n = 2 mice per group. c, Bubble plot of ribosome subunit genes between MIA male and PBS male offspring at E14.5, demonstrating a widespread decrease in expression of multiple ribosomal subunits in MIA male offspring. All significant genes FDR < 0.05. Blue indicates an increase in PBS males relative to MIA males. Data from n = 2 mice per group. d, Bubble plot of ribosome subunit genes between MIA female and PBS female offspring at E14.5, demonstrating an increase in expression of multiple ribosomal subunits in MIA female offspring. All significant genes FDR < 0.05. Blue indicates an increase in PBS females relative to MIA females. Data from n = 2 mice per group.
Extended Data Fig. 5
Extended Data Fig. 5. Sex-specific comparisons in control (PBS) conditions
a, Bubble plot of ribosome subunit genes between PBS male and PBS female offspring at E14.5. All significant genes FDR < 0.05. Data from n = 2 mice per group. b, Bubble plot of ribosome subunit genes between PBS male and PBS female offspring at E18.5. All significant genes FDR < 0.05. Data from n = 2 mice per group.
Extended Data Fig. 6
Extended Data Fig. 6. Upstream regulators of phospho-eIF2α and UPR sensors in E18.5 PBS and MIA fetal cortices
a, Immunoblot analysis measuring phospho-S6K and quantification in E18 PBS and MIA fetal cortices. Y-axis represents relative blot intensity to PBS male control (Two-way ANOVA sex (male or female) × stimulus (PBS or MIA) interaction F1,12 = 0.08413, P = 0.7767; effect of sex F1,12 = 1.188, P = 0.2971; effect of stimulus F1,12 = 0.04729, P = 0.8315 followed by Tukey multiple comparisons test; n = 4 pups from 2 litters). b, Immunoblot analysis measuring upstream regulators of phospho-eIF2α and quantification in E18.5 PBS and MIA fetal cortices. Y-axis represents relative blot intensity to PBS control for each sex (Two-tailed unpaired t-test male: pPERK t = 5.485, df = 10, ***P = 0.0003, n = 6 from 3 litters; pGCN2 t = 0.1503, df = 6, n = 4 pups from 2 litters; pPKR t = 0.9501, df = 6, n = 4 pups from 2 litters; Two-tailed unpaired t-test female: pPERK t = 0.5761, df = 6; pGCN2 t = 0.5204, df = 6; pPKR t = 1.545, df = 6; n = 4 pups from 2 litters). c, Immunoblot analysis measuring UPR sensors (IRE1α, ATF6 and PERK) and quantification in E18.5 PBS and MIA male fetal cortices. Y-axis represents relative blot intensity to PBS control (Two-tailed unpaired t-test: pIRE t = 2.745, df = 6, *P = 0.0335; ATF6 t = 0.6822, df = 6; pPERK t = 3.516, df = 6, * P = 0.0126; n = 4 pups from 2 litters). Data are mean ± SEM; see Supplementary Table 20 for detailed statistics. Unprocessed blots are provided as a Source Data file.
Extended Data Fig. 7
Extended Data Fig. 7. ISR activation of E18.5 PBS and MIA male fetus in SFB-negative dams
Immunoblot analysis measuring phospho-eIF2α and quantification in E18.5 PBS and MIA male fetal cortices, either from SFB-positive or SFB-negative B6 dams. SFB-positive dams were obtained from Taconic Biosciences (Tac) whereas SFB-negative dams from Jackson laboratory (Jax) and maintained in SFB-positive and negative conditions, respectively. Y-axis represents relative blot intensity to each PBS control (Two-tailed unpaired t-test: Tac t = 4.659, df = 6, **P = 0.0035; Jax t = 0.9013, df = 6; n = 4 pups from 2 litters). Data are mean ± SEM; see Supplementary Table 20 for detailed statistics. Unprocessed blots are provided as a Source Data file.
Extended Data Fig. 8
Extended Data Fig. 8. Female MIA offspring neither show ISR activation nor neurodevelopmental abnormalities
a, Representative images of 8-10 weeks old MIA and PBS female offspring brain tissue immunostained for c-Fos. Scale bar 100 μm. Quantification indicates c-Fos puncta/mm2 (Two-tailed unpaired t-test PBS female versus MIA female: t = 0.1829, df = 5, P = 0.8621; n= 3 for PBS female, n = 4 for MIA female mice). b, Percentage of interaction in the three-chamber sociability test of adult PBS and MIA female offspring littermates (Two-way ANOVA group (PBS female or MIA female) x preference to the target (social target or inanimate) interaction F1,22= 0.986, P = 0.3315; effect of preference to the target F1,22 = 45.24 , P = 9.2454 x 10⁻⁷ followed by Sidak multiple comparisons test-within group: PBS female ** P = 0.0015, MIA female **** P = 2.06 x 10⁻⁵; Two-tailed unpaired t-test social score between PBS female versus MIA female: t = 0.7021, df = 11, P = 0.4972; n = 6 for PBS female, n = 7 for MIA female mice; 2 independent experiments). c, Marble burying index of adult PBS and MIA female offspring littermates (Two-tailed unpaired t-test PBS female versus MIA female: t = 0.9278, df = 15, P = 0.3682; n = 8 for PBS female, n = 9 for MIA female mice; 2 independent experiments). Data are mean ± SEM; see Supplementary Table 20 for detailed statistics.
Extended Data Fig. 9
Extended Data Fig. 9. Pharmacological inhibition of ISR protects MIA offspring from neurobehavioral abnormalities
a, Percentage of interaction in the three-chamber sociability test of vehicle and ISRIB-treated adult PBS and MIA offspring littermates (Two-way ANOVA group (PBS vehicle, MIA vehicle, PBS ISRIB or MIA ISRIB) x preference to the target (social target or inanimate) interaction F3,62 = 7.401, P = 0.003; effect of preference to the target F1,62 = 57.62 , P = 2 x 10⁻¹⁰ followed by Bonferroni multiple comparisons test-within group: PBS vehicle **** P = 4.9 x 10⁻¹⁰, PBS ISRIB * P = 0.0119, MIA vehicle P > 0.9999, MIA ISRIB **** P = 2.76 x 10⁻⁵; two-way ANOVA stimulus (PBS or MIA) x treatment (vehicle or ISRIB) interaction F1,31 = 7.111, P = 0.0121; effect of stimulus F1,31 = 4.109, P = 0.0513; effect of treatment F1,31 = 0.003618, P = 0.9524 followed by Dunnett multiple comparisons test: PBS vehicle versus PBS ISRIB P = 0.19, MIA vehicle versus PBS vehicle **P = 0.0071, PBS vehicle versus MIA ISRIB P = 0.3031; n = 10 for PBS vehicle, n = 7 for MIA vehicle, n = 7 for PBS ISRIB, n = 11 for MIA ISRIB; 2 independent experiments). b, Marble burying index of vehicle and ISRIB-treated adult PBS and MIA offspring littermates (Two-way ANOVA stimulus (PBS or MIA) x treatment (vehicle or ISRIB) interaction F1,13 = 4.549, P = 0.0526; effect of stimulus F1,13 = 8.829, P = 0.0108; effect of treatment F1,13 = 4.341, P = 0.0575 followed by Tukey multiple comparisons test: PBS vehicle versus MIA vehicle *P = 0.0147, PBS ISRIB versus MIA vehicle *P = 0.0255, MIA vehicle vs. MIA ISRIB *P = 0.0275; n = 4 for PBS vehicle, n = 4 for MIA vehicle, n = 3 for PBS ISRIB, n = 6 for MIA ISRIB mice; 2 independent experiments). Data are mean ± SEM; see Supplementary Table 20 for detailed statistics.
Figure 1.
Figure 1.. Single-cell sequencing of the fetal brain at E14.5 and E18.5 in the setting of Maternal Immune Activation
a, Schematic overview of the experimental design, including dissociation of embryonic cortices, single cell encapsulation, and library preparation. b, UMAP of all analyzed E14.5 cells, with cell types labeled by color (n = 22 clusters). Data from n = 2 mice per group. c, UMAP of all analyzed E18.5 cells, with cell types labeled by color (n = 24 clusters). Data from n = 2 mice per group. d, Strip plot displaying differential gene expression between MIA male offspring and PBS male offspring at E14.5. Colored dots represent significant genes (FDR < 0.05). X-axis displays select cortical cell types. Data from n = 2 mice per group. e, Heat map of single cell gene expression changes of select genes in two cell types at E14.5: Neurod2-positive cortical excitatory neurons (A) and Gad2-positive inhibitory neurons (B). Comparisons labeled “PBS male” are pairwise comparisons between PBS males and MIA males. For these comparisons, blue corresponds to increased expression in MIA males, while pink corresponds to decreased expression in MIA males. Comparisons labeled “MIA female” are multi-factor comparisons measuring the difference between the changes in expression with MIA between male and female mice. For these comparisons, blue corresponds to an increase in the difference between MIA and PBS expression levels in males, while pink corresponds to a decrease in this difference. Data from n = 2 mice per group. f, GO analysis of differentially expressed genes (FDR < 0.05) between MIA and PBS male offspring in select cell types at E14.5. X-axis displays fold enrichment relative to reference gene set. Data from n = 2 mice per group. g, Volcano plot of MIA-dependent gene expression in Layer II-IV cluster A neurons at E18.5. Colored dots indicate statistical significance (FDR < 0.05). Positive log2FC (red dots) indicates higher gene expression in PBS males relative to MIA males, and negative log2FC (blue dots) indicates higher gene expression in MIA males relative to PBS males. Data from n = 2 mice per group. h, Strip plot displaying sex-dependent gene expression in MIA offspring at E14.5. Colored dots represent significant genes (FDR < 0.05, log2(Fold Change) > 0.5. X-axis displays select cortical cell types. Data from n = 2 mice per group. i, GO analysis of sex-dependent genes in MIA offspring in select cell types at E14.5 (FDR < 0.05). X-axis displays fold enrichment relative to reference gene set. Data from n = 2 mice per group. j, Volcano plot of sex-dependent gene expression in MIA offspring in Layer II-IV cluster A neurons at E18.5. Colored dots indicate statistical significance (FDR < 0.05) by interaction term analysis to identify genes that vary by sex with MIA exposure. Negative log2FC values indicate Δ(PBS M – MIA M) < Δ (PBS F-MIA F). Data from n = 2 mice per group.
Figure 2.
Figure 2.. Single cell differential gene expression changes at E14.5
a, Bubble plot of highly variable genes between MIA and PBS male offspring at E14.5, demonstrating a widespread decrease in expression of multiple ribosomal subunits in MIA male offspring. All significant genes FDR < 0.05. Blue indicates an increase in MIA males, and red indicates an increase in PBS males. Data from n = 2 mice per group. b, Bubble plot of sex-dependent genes in MIA offspring at E14.5, demonstrating a widespread decrease in expression of multiple ribosomal subunits in MIA male offspring. All significant genes FDR < 0.05. Blue indicates an increase in Δ(MIA males – PBS males), and red indicates an increase in Δ(MIA females – PBS females). Data from n = 2 mice per group.
Figure 3.
Figure 3.. MIA inhibits protein translation in the fetal brain via the integrated stress response
a, TAMRA-conjugated proteins labeled by OPP were extracted and isolated by SDS-PAGE and analyzed by fluorescence scan at 532 nm. Representative section of Coomassie-stained gel for loading comparison (Two-way ANOVA sex (male or female) × stimulus (PBS or MIA) interaction F1,14 = 5.874, P = 0.0295; effect of sex F1,14 = 0.4167, P = 0.5290; effect of stimulus F1,14 = 7.462, P = 0.0162 followed by Tukey multiple comparisons test: PBS male versus MIA male **P = 0.0082; n = 5 for PBS male and MIA male, n = 4 for PBS female and MIA female pups; 3 independent litters for PBS, 2 independent litters for MIA). b, Schematic representation of the regulation of translation initiation through eIF2α -dependent regulation and mTOR-dependent regulation. c, Immunoblot analysis measuring phospho-eIF2α and phospho-PERK levels and quantification for phospho-eIF2α in E18.5 PBS and MIA fetal cortices. Y-axis represents relative blot intensity to PBS male control (Two-way ANOVA sex (male or female) × stimulus (PBS or MIA) interaction F1,22 = 8.229, P = 0.0089; effect of sex F1,22 = 3.939, P = 0.0598; effect of stimulus F1,22 = 7.567, P = 0.0117 followed by Tukey multiple comparisons test: PBS male versus MIA male ***P = 0.0009, PBS female versus MIA male *P = 0.0118, MIA male versus MIA female **P = 0.0097; n = 7 for PBS male, n = 9 for MIA male, n = 5 for PBS female and MIA female pups; 3 independent litters). d, Immunoblot analysis measuring phospho-eIF2α and phospho-PERK levels and quantification for phospho-eIF2α in isotype antibody or IL-17a-blocking antibody-treated E18.5 PBS and MIA fetal cortices. Y-axis represents relative blot intensity to the isotype antibody-treated PBS control (phospho-eIF2α: one-way ANOVA, F2,23 = 14.88, P = 7.14 x 10⁻⁵, Tukey’s multiple comparisons test: PBS isotype ab versus MIA isotype ab ****P = 5.58 x 10⁻⁵, MIA isotype ab versus MIA anti-IL-17a **P = 0.0083; phospho-PERK: one-way ANOVA, F2,23 = 7.259, P = 0.0036, Tukey’s multiple comparisons test: PBS isotype ab versus MIA isotype ab **P = 0.0036, MIA isotype ab versus MIA anti-IL-17a *P = 0.0423; n = 8 for PBS isotype ab and MIA anti-IL-17a, n = 10 for MIA isotype ab; 3 independent litters). Data are mean ± SEM; see Supplementary Table 20 for detailed statistics. Unprocessed blots are provided as a Source Data file.
Figure 4.
Figure 4.. Alterations in the translational landscape of the MIA fetal brain
a, Schematic of experimental approach for ribosome profiling. b, Percentage of ribosome profiling reads in frame 0 by experimental condition. Data are mean ± SEM. Data n = 7 for PBS and n = 7 for MIA, each from 2 independent litters. c, Bar graph of ORF subtypes based on transcript types and ORF locations between all experimental groups. Data are mean ± SEM. For individual data underlying this plot, see Supplementary Table 21. Data n = 7 for PBS and n = 7 for MIA, each from 2 independent litters. d, Quadrant plot of transcriptional and translational changes in MIA male offspring compared to PBS male offspring. Genes significant only in the total mRNA-seq are in blue, genes significant only in the ribo-seq are in red, and genes significant in both are in green. Significant transcripts have a FDR < 0.05. Positive log2 fold change values indicate an increase in the PBS group. Data n = 7 for PBS and n = 7 for MIA, each from 2 independent litters. e, Quadrant plot of transcriptional and translational changes in MIA female offspring compared to PBS female offspring. Transcripts significant only in the total mRNA-seq are in blue, transcripts significant only in the ribo-seq are in red, and transcripts significant in both are in green. Significant transcripts have a FDR < 0.05. Positive log2 fold change values indicate an increase in the PBS group. Data n = 7 for PBS and n = 7 for MIA, each from 2 independent litters. f, Heat map of log2 Fold Change of transcriptional (RNA-seq) and translational (Ribo-seq) changes in MIA males and females relative to sex-matched PBS controls. Genes are known targets of the ISR response to chronic stress and translational machinery. Black outlines indicate statistically significant (FDR < 0.05) changes relative to corresponding sex-matched PBS controls in a multi-factor EdgeR analysis. Positive log2 fold change values, shown in red, indicate an increase in the PBS group, while negative log2 fold change values, shown in blue, indicate an increase in the MIA group. Data n = 7 for PBS and n = 7 for MIA, each from 2 independent litters.
Figure 5.
Figure 5.. Genetic ablation of ISR protects excessive neural activity in MIA offspring
a, Immunoblot analysis measuring phospho-eIF2α, phospho-PERK and phospho-S6K levels and quantification for phospho-eIF2α in wildtype and eIF2αS51A/+ E18.5 male fetal cortices. Y-axis represents relative blot intensity to the wildtype PBS fetal cortices (Two-way ANOVA stimulus (PBS or MIA) x genotype (wildtype or eIF2αS51A/+) interaction F1,12 = 6.055, P = 0.03; effect of stimulus F1,12 = 10.88, P = 0.0064; effect of genotype F1,12 = 18.34, P = 0.0011 followed by Tukey multiple comparisons test: PBS wildtype versus MIA wildtype **P = 0.0073, MIA wildtype versus PBS eIF2αS51A/+ ***P = 0.0008, MIA wildtype versus MIA eIF2αS51A/+ **P = 0.0022; n = 4 pups from 2 independent litters). b, TAMRA-conjugated proteins labeled by OPP were extracted and isolated by SDS-PAGE and analyzed by fluorescence scan at 532 nm. Representative section of Coomassie-stained gel for loading comparison (Two-way ANOVA stimulus (PBS or MIA) x genotype (wildtype or eIF2αS51A/+) interaction F1,20 = 14.35, P = 0.0012; effect of stimulus F1,20 = 3.265, P = 0.0858; effect of genotype F1,20 = 7.283, P = 0.0138 followed by Tukey multiple comparisons test: PBS wildtype versus MIA wildtype **P = 0.004, MIA wildtype versus PBS eIF2αS51A/+ *P = 0.0221, MIA wildtype versus MIA eIF2αS51A/+ ***P = 0.0004; n = 5 for PBS wildtype and PBS eIF2αS51A/+ from 3 independent litters, n = 7 for MIA wildtype and MIA eIF2αS51A/+ pups from 3 independent litters). c, Representative images of 8-10 weeks brain tissue immunostained for c-Fos. Conditions are MIA and PBS wildtype and eIF2αS51A/+ male mice. Scale bar 100 μm. Quantification indicates c-Fos puncta/mm2 (Two-way ANOVA stimulus (PBS or MIA) x genotype (wildtype or eIF2αS51A/+) interaction F1,11 = 8.320, P = 0.0149; effect of stimulus F1,11 = 9.007, P = 0.0121; effect of genotype F1,11 = 2.798, P = 0.1226 followed by Tukey multiple comparisons test: PBS wildtype versus MIA wildtype **P = 0.0056, MIA wildtype versus PBS eIF2αS51A/+ *P = 0.0373, MIA wildtype versus MIA eIF2αS51A/+ *P = 0.0281; n = 3 for PBS eIF2αS51A/+, n = 4 for PBS wildtype, MIA wildtype and MIA eIF2αS51A/+; 2 independent litters per group.) Data are mean ± SEM; see Supplementary Table 20 for detailed statistics. Unprocessed blots are provided as a Source Data file.
Figure 6.
Figure 6.. Genetic ablation of ISR protects MIA offspring from neurobehavioral abnormalities
a-b, Percentage of interaction (a) (Two-way ANOVA group (PBS wildtype, MIA wildtype, PBS eIF2αS51A/+ or MIA eIF2αS51A/+) x preference to the target (social target or inanimate) interaction F3,118 = 19.23, P = 3.214 x 10⁻¹⁰; effect of preference to the target F1,118 = 170.1, P = 1.0 x 10⁻¹⁵ followed by Sidak multiple comparisons test-within group: PBS wildtype **** P = 7.9 x 10⁻¹⁰, PBS eIF2αS51A/+ **** P = 1.19 x 10⁻¹¹, MIA wildtype P = 0.7772, MIA eIF2αS51A/+ **** P = 2 x 10⁻¹⁵; two-way ANOVA stimulus (PBS or MIA) x genotype (wildtype or eIF2αS51A/+) interaction F1,59 = 5.275, P = 0.0252; effect of stimulus F1,59 = 5.100, P = 0.0276; effect of genotype F1,59 = 12.56, P = 0.0008 followed by Tukey multiple comparisons test: PBS wildtype versus MIA wildtype **P = 0.0054, MIA wildtype versus PBS eIF2αS51A/+ ***P = 0.0008, MIA wildtype versus MIA eIF2αS51A/+ ***P = 0.0001), and total distance moved (b) (Two-way ANOVA stimulus (PBS or MIA) x genotype (wildtype or eIF2αS51A/+) interaction F1,59 = 0.1195, P = 0.7308; effect of stimulus F1,59 = 0.2629, P = 0.6101; effect of genotype F1,59 = 0.6928, P = 0.4086) in the three-chamber sociability test of wildtype and eIF2αS51A/+ adult PBS and MIA offspring littermates (n = 14 for PBS wildtype, n = 11 for PBS eIF2αS51A/+, n = 22 for MIA wildtype, n = 16 for MIA eIF2αS51A/+ mice; 4 independent experiments). c, Marble burying index of wildtype and eIF2αS51A/+ adult PBS and MIA offspring littermates (Two-way ANOVA stimulus (PBS or MIA) x genotype (wildtype or eIF2αS51A/+) interaction F1,38 = 8.180, P = 0.0068; effect of stimulus F1,38 = 5.410, P = 0.0255; effect of genotype F1,38 = 3.111, P = 0.0858 followed by Tukey multiple comparisons test: PBS wildtype versus MIA wildtype **P = 0.0025, MIA wildtype versus PBS eIF2αS51A/+ *P = 0.0292, MIA wildtype versus MIA eIF2αS51A/+ **P = 0.0045; n = 9 for PBS wildtype, n = 8 for PBS eIF2αS51A/+, n = 14 for MIA wildtype, n = 11 for MIA eIF2αS51A/+; 3 independent experiments). Data are mean ± SEM; see Supplementary Table 20 for detailed statistics.

Comment in

References

    1. Buffington SA et al. Microbial Reconstitution Reverses Maternal Diet-Induced Social and Synaptic Deficits in Offspring. Cell 165, 1762–1775 (2016). - PMC - PubMed
    1. Hashimoto-Torii K et al. Roles of heat shock factor 1 in neuronal response to fetal environmental risks and its relevance to brain disorders. Neuron 82, 560–572 (2014). - PMC - PubMed
    1. Gladwyn-Ng I et al. Stress-induced unfolded protein response contributes to Zika virus-associated microcephaly. Nat. Neurosci 21, 63–71 (2018). - PubMed
    1. Al-Haddad BJS et al. Long-term Risk of Neuropsychiatric Disease After Exposure to Infection In Utero. JAMA Psychiatry 76, 594–602 (2019). - PMC - PubMed
    1. Atladóttir HO et al. Maternal infection requiring hospitalization during pregnancy and autism spectrum disorders. J. Autism Dev. Disord 40, 1423–1430 (2010). - PubMed

Method-only References

    1. Hrvatin S et al. Single-cell analysis of experience-dependent transcriptomic states in the mouse visual cortex. Nat. Neurosci 21, 120–129 (2018). - PMC - PubMed
    1. Klein AM et al. Droplet barcoding for single-cell transcriptomics applied to embryonic stem cells. Cell 161, 1187–1201 (2015). - PMC - PubMed
    1. Wolock SL, Lopez R & Klein AM Scrublet: Computational Identification of Cell Doublets in Single-Cell Transcriptomic Data. Cell Syst 8, 281–291.e9 (2019). - PMC - PubMed
    1. Robinson MD, McCarthy DJ & Smyth GK edgeR: a Bioconductor package for differential expression analysis of digital gene expression data. Bioinformatics 26, 139–140 (2010). - PMC - PubMed
    1. McCarthy DJ, Chen Y & Smyth GK Differential expression analysis of multifactor RNA-Seq experiments with respect to biological variation. Nucleic Acids Res. 40, 4288–4297 (2012). - PMC - PubMed

Publication types

MeSH terms