

Gene and protein expression of mTOR and LC3 in hepatocellular carcinoma, colorectal liver metastasis and "normal" liver tissues
- PMID: 33362215
- PMCID: PMC7757890
- DOI: 10.1371/journal.pone.0244356
Gene and protein expression of mTOR and LC3 in hepatocellular carcinoma, colorectal liver metastasis and "normal" liver tissues
Abstract
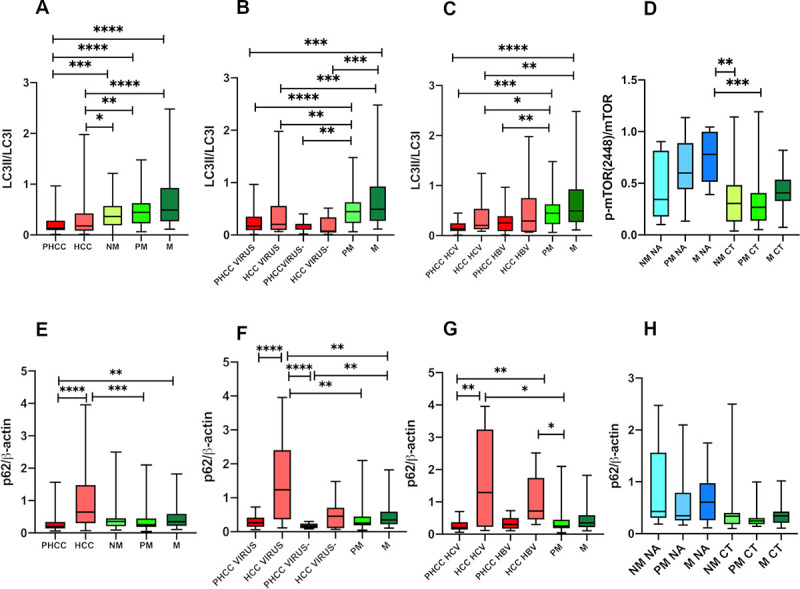
The physiological role of autophagy in the progression of liver diseases is still debated. To understand the clinical relevance of autophagy in primary e secondary hepatic tumors, we analyzed the expression of mTOR (mammalian target of rapamycin), a key regulator of autophagy; Raptor (regulatory-associated protein of mTOR); ULK1 (Unc-51 like kinase 1) determinant in the autophagy initiation; LC3 (microtubule-associated protein 1A/1B-light chain 3), a specific marker of autophagosomes; and p62, a selective autophagy receptor. Samples from subjects with chronic hepatitis (n.58), cirrhosis (n.12), hepatocellular carcinoma (HCC, n.56), metastases (n.48) from colorectal cancer and hyperplasia or gallbladder stones (n.7), the latter considered as controls, were examined. Gene expression analysis was carried out in n.213 tissues by absolute q-PCR, while protein expression by Western Blot in n.191 lysates, including tumoral, surrounding tumoral and normal tissues. Nonparametric statistical tests were used for comparing expression levels in the above-mentioned groups. Subgroup analysis was performed considering viral infection and chemotherapy treatment. The mTOR transcriptional level was significantly lower in metastases compared to HCC (P = 0.0001). p-mTOR(Ser2448) and LC3II/LC3I protein levels were significantly higher in metastases compared to HCC (P = 0.008 and P<0.0001, respectively). ULK(Ser757) levels were significantly higher in HCC compared to metastases (P = 0.0002) while the HCV- and HBV- related HCC showed the highest p62 levels. Chemotherapy induced a down-regulation of the p-mTOR(Ser2448) in metastases and in non-tumor surrounding tissues in treated patients compared to untreated (P = 0.001 and P = 0.005, respectively). Conclusions: the different expression of proteins considered, owning their interaction and diverse tissue microenvironment, indicate an impairment of the autophagy flux in primary liver tumors that is critical for the promotion of tumorigenesis process and a coexistence of autophagy inhibition and activation mechanisms in secondary liver tumors. Differences in mTOR and LC3 transcripts emerged in tumor-free tissues, therefore particular attention should be considered in selecting the control group.
Conflict of interest statement
The authors have declared that no competing interests exist.
Figures


Similar articles
-
Clusterin contributes to hepatitis C virus-related hepatocellular carcinoma by regulating autophagy.Life Sci. 2020 Sep 1;256:117911. doi: 10.1016/j.lfs.2020.117911. Epub 2020 Jun 3. Life Sci. 2020. PMID: 32504756
-
Autophagy-related genes Raptor, Rictor, and Beclin1 expression and relationship with multidrug resistance in colorectal carcinoma.Hum Pathol. 2015 Nov;46(11):1752-9. doi: 10.1016/j.humpath.2015.07.016. Epub 2015 Jul 30. Hum Pathol. 2015. PMID: 26363527
-
Dual PI3K/mTOR inhibitor NVP-BEZ235-induced apoptosis of hepatocellular carcinoma cell lines is enhanced by inhibitors of autophagy.Int J Mol Med. 2013 Jun;31(6):1449-56. doi: 10.3892/ijmm.2013.1351. Epub 2013 Apr 16. Int J Mol Med. 2013. PMID: 23588698
-
The Role of Autophagy in Hepatocellular Carcinoma.Int J Mol Sci. 2015 Nov 6;16(11):26629-43. doi: 10.3390/ijms161125984. Int J Mol Sci. 2015. PMID: 26561802 Free PMC article. Review.
-
mTOR in viral hepatitis and hepatocellular carcinoma: function and treatment.Biomed Res Int. 2014;2014:735672. doi: 10.1155/2014/735672. Epub 2014 Apr 2. Biomed Res Int. 2014. PMID: 24804240 Free PMC article. Review.
Cited by
-
Loss of monopolar spindle-binding protein 3B expression promotes colorectal cancer invasiveness by activation of target of rapamycin kinase/autophagy signaling.World J Gastroenterol. 2024 Jul 14;30(26):3229-3246. doi: 10.3748/wjg.v30.i26.3229. World J Gastroenterol. 2024. PMID: 39086630 Free PMC article.
-
Unraveling the Janus-Faced Role of Autophagy in Hepatocellular Carcinoma: Implications for Therapeutic Interventions.Int J Mol Sci. 2023 Nov 13;24(22):16255. doi: 10.3390/ijms242216255. Int J Mol Sci. 2023. PMID: 38003445 Free PMC article. Review.
-
Fibroblast Growth Factor 21 Response in a Preclinical Alcohol Model of Acute-on-Chronic Liver Injury.Int J Mol Sci. 2021 Jul 23;22(15):7898. doi: 10.3390/ijms22157898. Int J Mol Sci. 2021. PMID: 34360670 Free PMC article.
-
Normalization of the ATP1A1 Signalosome Rescinds Epigenetic Modifications and Induces Cell Autophagy in Hepatocellular Carcinoma.Cells. 2023 Sep 27;12(19):2367. doi: 10.3390/cells12192367. Cells. 2023. PMID: 37830582 Free PMC article.
References
-
- Marsh R, Ph D, Stefan M, Bansal R, Ph D, Hao X, et al. Autophagy, Metabolism, and Cancer. Clin Cancer Res. 2016;77: 616–623. 10.1016/j.biopsych.2013.07.017.Anatomical - DOI
-
- Santana-Codina N, Mancias JD, Kimmelman AC. The Role of Autophagy in Cancer. In: Jacks, T and Sawyers, CL, editor. ANNUAL REVIEW OF CANCER BIOLOGY, VOL 1. 4139 EL CAMINO WAY, PO BOX 10139, PALO ALTO, CA 94303–0897 USA: ANNUAL REVIEWS; 2017. pp. 19–39. 10.1146/annurev-cancerbio-041816-122338 - DOI - PMC - PubMed
Publication types
MeSH terms
Substances
LinkOut - more resources
Full Text Sources
Medical
Miscellaneous
