

Assessing the risk of dengue severity using demographic information and laboratory test results with machine learning
- PMID: 33362244
- PMCID: PMC7757819
- DOI: 10.1371/journal.pntd.0008960
Assessing the risk of dengue severity using demographic information and laboratory test results with machine learning
Abstract
Background: Dengue virus causes a wide spectrum of disease, which ranges from subclinical disease to severe dengue shock syndrome. However, estimating the risk of severe outcomes using clinical presentation or laboratory test results for rapid patient triage remains a challenge. Here, we aimed to develop prognostic models for severe dengue using machine learning, according to demographic information and clinical laboratory data of patients with dengue.
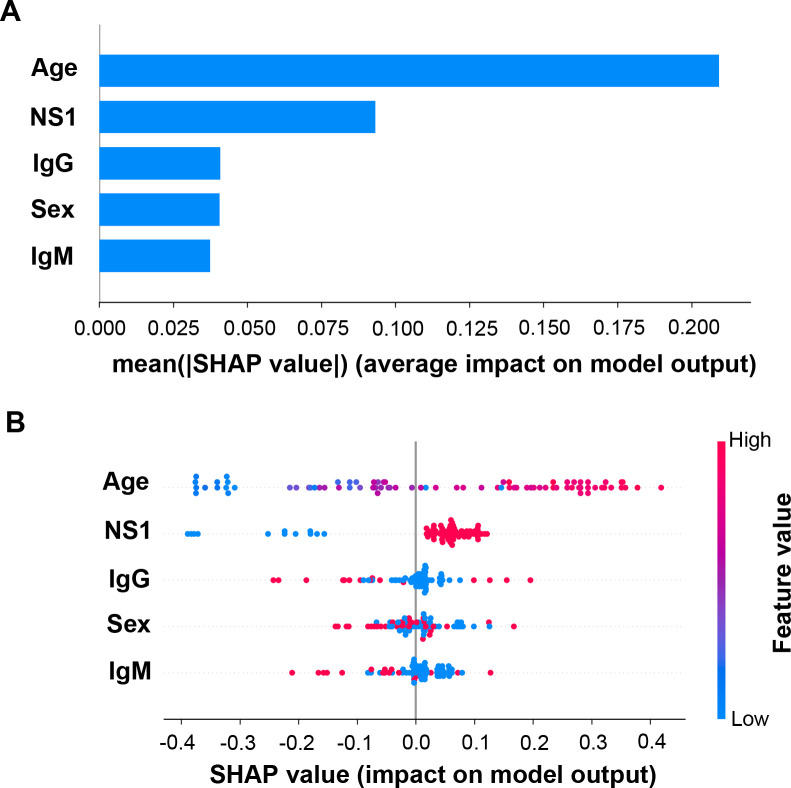
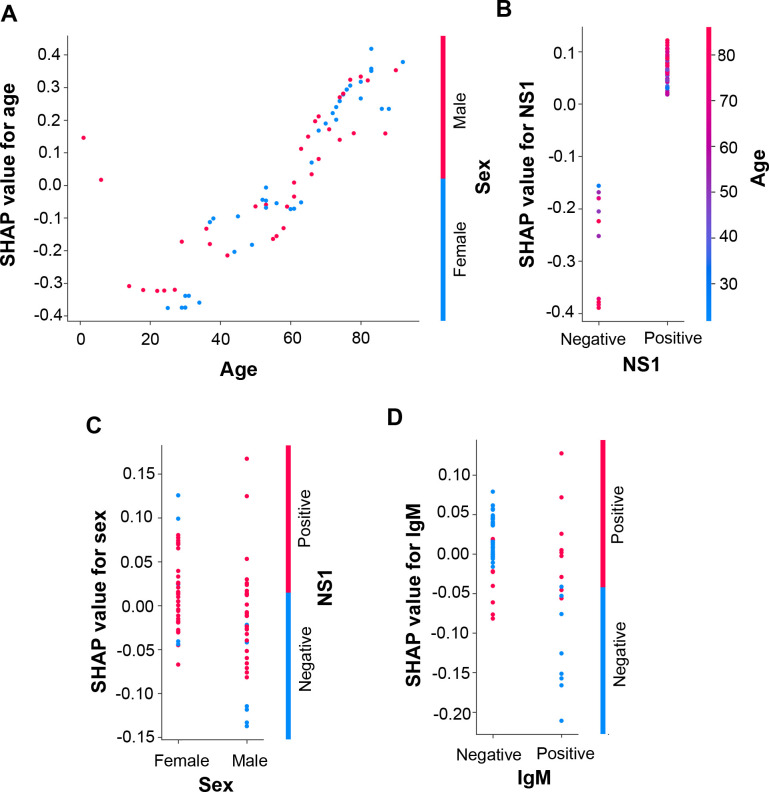
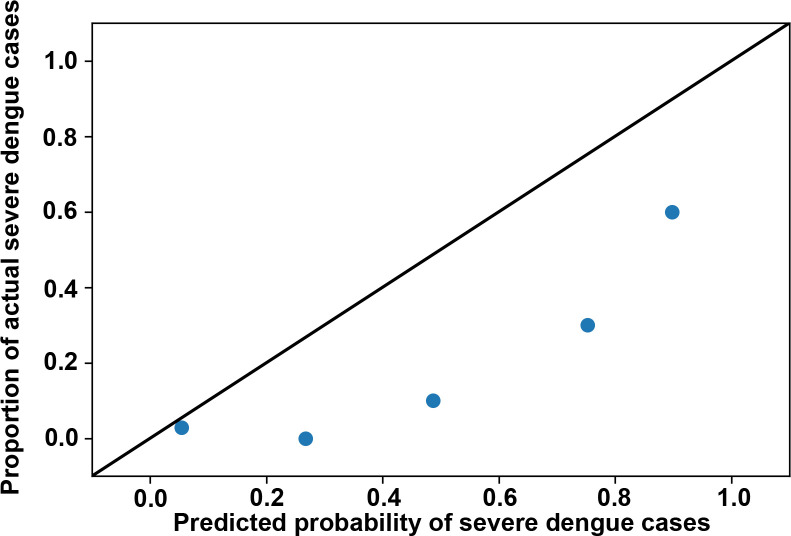
Methodology/principal findings: Out of 1,581 patients in the National Cheng Kung University Hospital with suspected dengue infections and subjected to NS1 antigen, IgM and IgG, and qRT-PCR tests, 798 patients including 138 severe cases were enrolled in the study. The primary target outcome was severe dengue. Machine learning models were trained and tested using the patient dataset that included demographic information and qualitative laboratory test results collected on day 1 when they sought medical advice. To develop prognostic models, we applied various machine learning methods, including logistic regression, random forest, gradient boosting machine, support vector classifier, and artificial neural network, and compared the performance of the methods. The artificial neural network showed the highest average discrimination area under the receiver operating characteristic curve (0.8324 ± 0.0268) and balance accuracy (0.7523 ± 0.0273). According to the model explainer that analyzed the contributions/co-contributions of the different factors, patient age and dengue NS1 antigenemia were the two most important risk factors associated with severe dengue. Additionally, co-existence of anti-dengue IgM and IgG in patients with dengue increased the probability of severe dengue.
Conclusions/significance: We developed prognostic models for the prediction of dengue severity in patients, using machine learning. The discriminative ability of the artificial neural network exhibited good performance for severe dengue prognosis. This model could help clinicians obtain a rapid prognosis during dengue outbreaks. However, the model requires further validation using external cohorts in future studies.
Conflict of interest statement
The authors have declared that no competing interests exist.
Figures

References
-
- Khursheed M, Khan UR, Ejaz K, Fayyaz J, Qamar I, Razzak JA. A comparison of WHO guidelines issued in 1997 and 2009 for dengue fever—single centre experience. J Pak Med Assoc. 2013;63:670–674. - PubMed
Publication types
MeSH terms
LinkOut - more resources
Full Text Sources
Medical
