. 2020 Dec 23;16(12):e1009148.
doi: 10.1371/journal.ppat.1009148. eCollection 2020 Dec.

Directed evolution reveals the mechanism of HitRS signaling transduction in Bacillus anthracis

Affiliations

Directed evolution reveals the mechanism of HitRS signaling transduction in Bacillus anthracis

Hualiang Pi et al. PLoS Pathog. .

Abstract

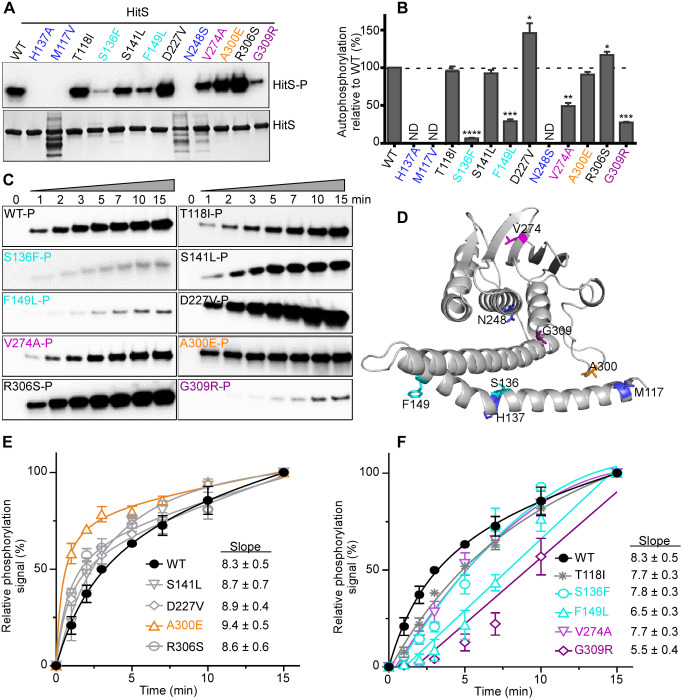
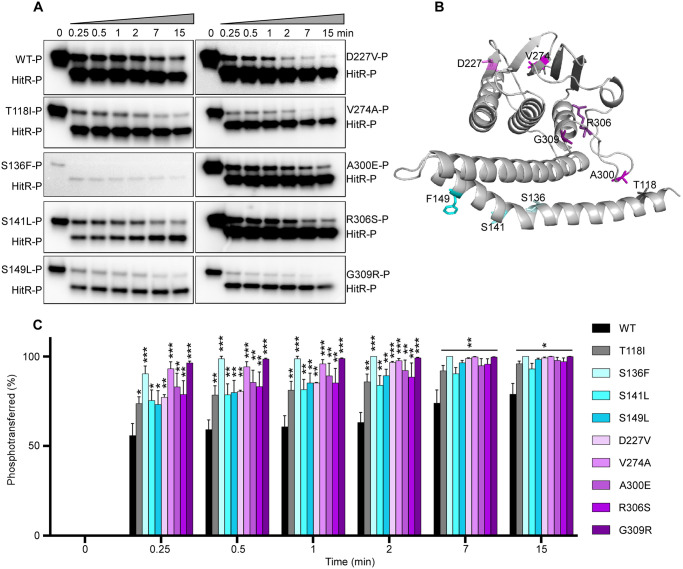
Two component systems (TCSs) are a primary mechanism of signal sensing and response in bacteria. Systematic characterization of an entire TCS could provide a mechanistic understanding of these important signal transduction systems. Here, genetic selections were employed to dissect the molecular basis of signal transduction by the HitRS system that detects cell envelope stress in the pathogen Bacillus anthracis. Numerous point mutations were isolated within HitRS, 17 of which were in a 50-residue HAMP domain. Mutational analysis revealed the importance of hydrophobic interactions within the HAMP domain and highlighted its essentiality in TCS signaling. In addition, these data defined residues critical for activities intrinsic to HitRS, uncovered specific interactions among individual domains and between the two signaling proteins, and revealed that phosphotransfer is the rate-limiting step for signal transduction. Furthermore, this study establishes the use of unbiased genetic selections to study TCS signaling and provides a comprehensive mechanistic understanding of an entire TCS.


Conflict of interest statement

No authors have competing interests.

Figures

Fig 1
Fig 1. Genetic selection strategies to study HitRS signaling mechanism.
(A) Schematics of the modular structure of a prototypical TCS. A classic histidine kinase (HK) consists of five domains: a N-terminal Trans-Membrane domain (TM), a sensor domain, a HAMP domain, a DHp domain, and a CA domain while a response regulator (RR) consists of two domains: a receiver domain and a DNA-binding domain. (B) Schematics for genetic selection strategies. To identify mutations that lead to constitutive activation of HitRS, an ermC strain shown in orange driven by a HitR promoter (Phit) was used. The two strains shown in blue (relE strains) were employed to isolate inactivating mutations within the TCS genes. (C) Growth kinetics of ermC expressing strains (WT and a representative ON mutant HitSS136A) were monitored in the presence or absence of 20 μg ml-1 of erythromycin. (D) Growth kinetics of relE expressing strains (WT and a representative OFF mutant HitSM117V) were monitored in the presence or absence of 20 μM ‘205. (E-F) Point mutations within HitS (E) and HitR (F) isolated from the genetic selections that lead to either inactivation (blue) or constitutive activation (orange) of this TCS.
Fig 2
Fig 2. Essentiality of HAMP domain for signal transduction.
(A) Multiple HAMP sequences were aligned to display the sequence property and conservation pattern of this domain. The two HAMP helices are underlined. The hydrophobic residues at the a and d positions of the heptad repeat pattern are highlighted in yellow and the residue in HAMP sequence that has been previously reported to be essential for signaling is shown in a box. The residues identified from genetic selections are highlighted in either orange or blue to specify either ON or OFF mutations, respectively. The residue Pro (P84) that can be mutated to either kinase ON or OFF state is highlighted in red. The sequences are from the following: HitS, B. anthracis; Af1503, A. fulgidus; Tar, E. coli; PhoQ, E. coli; CpxA, E. coli; EnvZ, E. coli; NarX, E. coli; Tsr, E. coli; Aer, E. coli; Rv3645, Mycobacterium tuberculosis; Lmo1061, Listeria monocytogenes; Vp0117, Vibrio parahaemolyticus. (B) All mutations isolated from genetic selections: OFF mutations are shown in blue while ON mutations are shown in orange. (C) All mutations are mapped onto the homology model based on A. fulgidus Af1503 (PDB ID: 4GN0). (D) All mutations were categorized into three groups based on their location in the homodimeric four-helix bundle.
Fig 3
Fig 3. Critical residues within HitRS stabilize protein and facilitate dimerization.
To evaluate the effects of HitR and HitS mutations on protein stability and dimerization, WT and mutant proteins were loaded onto SDS-PAGE (A, B) or native gels (C, D). Results shown are WT proteins and all mutants of HitS (A, C) or HitR (B, D) selected for further biochemical characterization. (F) Three HitR mutants affected protein dimerization as determined by size exclusion chromatography. Mutations that affect either protein stability or dimerization are mapped onto the homology models of HitS (E) or HitR (G). HitR model was generated based on M. tuberculosis RegX3 (PDB ID: 2OQR).
Fig 4
Fig 4. The autokinase activity of HitS can be modulated in four different manners.
To evaluate the effects of mutations on HitS autokinase activity, the autophosphorylation efficiency of HitS WT and mutants was investigated. (A) Representative phosphor-images (top panel) to show autophosphorylation of HitS WT and mutants that were incubated with ATP [γ-32P] for 30 min and quantified using a phosphoimager. The bottom panel is to show the amount of protein used for each reaction in an SDS-PAGE gel. The intensity of the phosphorylation signal was quantified and four independent experiments are shown in (B) (mean ± SEM). Significant differences between WT and each mutant are determined by two-tailed t-test, where *P < 0.05, **P < 0.01, ***P < 0.001, and ****P < 0.0001. (C) Representative phosphor-images to show the kinetics of autophosphorylation by HitS WT or ON mutants, which was monitored for 15 min. (D) Mutations that affect autophosphorylation are mapped onto the HitS model. (E, F) For better visualization, the intensity of the phosphor-signal at different timepoints was quantified and three independent experiments are presented in (E, F) (mean ± SEM). Mutants were organized into two graphs based on their autokinase activity. Data of the first four timepoints (i.e., 0, 1, 2, and 3 min) in E and F were used for slope determination by linear regression analysis.
Fig 5
Fig 5. Phosphotransfer is the rate limiting step for signal transduction.
To evaluate the effects of HitS ON mutations on transferring the phosphorylation signal, phosphotransfer efficiency of HitS WT or ON mutants to HitR WT was examined. (A) Representative phosphor images to show the kinetics of phosphotransfer from HitS WT or ON mutants to HitR WT, which was monitored for 15 min. (B) Mutations tested are mapped onto the HitS model. (C) The intensity of the lower band (signal transferred) was quantified and relative phospho-signal transferred at different time-points was calculated. Data shown in (C) are from three independent replicates (mean ± SEM). Significant differences determined by two-tailed t-test were observed between WT and each individual activating mutant, where *P < 0.05, **P < 0.01, and ***P < 0.001.
Fig 6
Fig 6. Critical residues required for the phosphatase activity of HitS.
To evaluate the effects of HitS mutation on its phosphatase activity, dephosphorylation efficiency of HitS WT and mutants was tested. (A) Representative phospho-images showing the dephosphorylation kinetics of HitS WT or mutants using phosphorylated HitR WT, which was monitored for 60 min. (B) Mutants with altered phosphatase activity were mapped onto the HitS model. (C-E) The intensity of phospho-signal was quantified and relative phospho-signal remaining at different time-points was calculated. Data shown are three independent replicates (mean ± SEM). Mutants were organized into three graphs for optimal visualization. Data of the first four timepoints (i.e., 0, 1, 3, 6 min) for each protein were used for slope determination by linear regression analysis.
Fig 7
Fig 7. Residues essential for HitR activation and specific interaction within HitR.
To examine the effects of HitR mutations on signal reception and DNA-binding, the phosphotransfer efficiency and DNA-binding affinity of HitR WT or mutants were tested. (A, B) Phosphotransfer efficiency from HitS WT to HitR WT or mutants was quantified. (A) The top is a representative phosphor image and the bottom is an SDS-PAGE gel showing the amount of protein used for each reaction. The intensity of radioactive signal was quantified and averages from four independent experiments are shown in (B) (mean ± SEM). Statistical significance was determined by two-tailed t-test, where *P < 0.05. (C) Kinetics of phosphotransfer from HitS WT to HitR WT or mutants was monitored for 30 min. Representative images are shown. The intensity of the lower band (phosphotransferred) at each timepoint was quantified. Presented are averages from three independent replicates (D) (mean ± SEM). (E) Representative images to show DNA-binding of HitR WT or mutants to its target promoter evaluated by EMSA. (F) The band intensity of unshifted DNA probe (lower band) was quantified using GelQuantNET. All data points from three independent experiments were plotted and subjected to Kd determination using GraphPad Prism 8 (mean ± SEM). (G) All point mutants tested are mapped onto a HitR structure model. All blue colors indicate OFF mutation while orange colors indicate ON mutation.

References

    1. Goel AK. Anthrax: A disease of biowarfare and public health importance. World J Clin Cases. 2015;3(1):20–33. 10.12998/wjcc.v3.i1.20 - DOI - PMC - PubMed
    1. Kamal SM, Rashid AK, Bakar MA, Ahad MA. Anthrax: an update. Asian Pac J Trop Biomed. 2011;1(6):496–501. 10.1016/S2221-1691(11)60109-3 - DOI - PMC - PubMed
    1. Shatalin K, Gusarov I, Avetissova E, Shatalina Y, McQuade LE, Lippard SJ, et al. Bacillus anthracis-derived nitric oxide is essential for pathogen virulence and survival in macrophages. Proceedings of the National Academy of Sciences. 2008;105(3):1009–13. 10.1073/pnas.0710950105 - DOI - PMC - PubMed
    1. Brunskill EW, Bayles KW. Identification and molecular characterization of a putative regulatory locus that affects autolysis in Staphylococcus aureus. J Bacteriol. 1996;178(3):611–8. 10.1128/jb.178.3.611-618.1996 - DOI - PMC - PubMed
    1. Fournier B, Klier A. Protein A gene expression is regulated by DNA supercoiling which is modified by the ArlS-ArlR two-component system of Staphylococcus aureus. Microbiology. 2004;150(Pt 11):3807–19. 10.1099/mic.0.27194-0 - DOI - PubMed

Publication types

MeSH terms

Substances