

Spreading of COVID-19: Density matters
- PMID: 33362283
- PMCID: PMC7757878
- DOI: 10.1371/journal.pone.0242398
Spreading of COVID-19: Density matters
Abstract
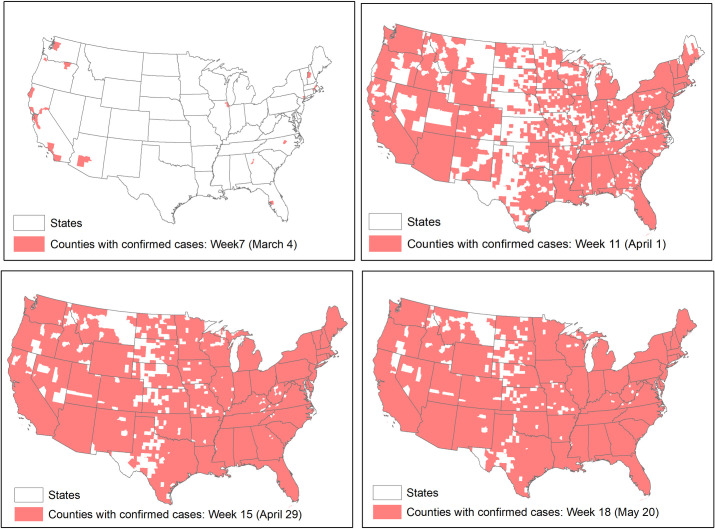
Physical distancing has been argued as one of the effective means to combat the spread of COVID-19 before a vaccine or therapeutic drug becomes available. How far people can be spatially separated is partly behavioral but partly constrained by population density. Most models developed to predict the spread of COVID-19 in the U.S. do not include population density explicitly. This study shows that population density is an effective predictor of cumulative infection cases in the U.S. at the county level. Daily cumulative cases by counties are converted into 7-day moving averages. Treating the weekly averages as the dependent variable and the county population density levels as the explanatory variable, both in logarithmic scale, this study assesses how population density has shaped the distributions of infection cases across the U.S. from early March to late May, 2020. Additional variables reflecting the percentages of African Americans, Hispanic-Latina, and older adults in logarithmic scale are also included. Spatial regression models with a spatial error specification are also used to account for the spatial spillover effect. Population density alone accounts for 57% of the variation (R-squared) in the aspatial models and up to 76% in the spatial models. Adding the three population subgroup percentage variables raised the R-squared of the aspatial models to 72% and the spatial model to 84%. The influences of the three population subgroups were substantial, but changed over time, while the contributions of population density have been quite stable after the first several weeks, ascertaining the importance of population density in shaping the spread of infection in individual counties, and in their neighboring counties. Thus, population density and sizes of vulnerable population subgroups should be explicitly included in transmission models that predict the impacts of COVID-19, particularly at the sub-county level.
Conflict of interest statement
The authors have declared that no competing interests exist.
Figures


References
-
- Bahl P, Doolan C, de Silva C, Chughtai AA, Bourouiba L, MacIntyre CR. Airborne or Droplet Precautions for Health Workers Treating Coronavirus Disease 2019? J Infect Dis [Internet]. [cited 2020 May 17]; Available from: https://academic.oup.com/jid/advance-article/doi/10.1093/infdis/jiaa189/... - DOI - PMC - PubMed
-
- Modes of transmission of virus causing COVID-19: implications for IPC precaution recommendations [Internet]. [cited 2020 May 26]. Available from: https://www.who.int/news-room/commentaries/detail/modes-of-transmission-...
-
- CDC. Coronavirus Disease 2019 (COVID-19) [Internet]. Centers for Disease Control and Prevention. 2020 [cited 2020 May 26]. Available from: https://www.cdc.gov/coronavirus/2019-ncov/hcp/infection-control-recommen...
-
- Gale R. Is ‘social distancing’ the wrong term? Expert prefers ‘physical distancing,’ and the WHO agrees. [Internet]. Washington Post. [cited 2020 May 26]. Available from: https://www.washingtonpost.com/lifestyle/wellness/social-distancing-coro...
Publication types
MeSH terms
LinkOut - more resources
Full Text Sources
Medical
