. 2020 Sep;41(3):591-622.
doi: 10.1111/1475-5890.12242. Epub 2020 Nov 30.

Furloughing

Affiliations

Furloughing

Abi Adams-Prassl et al. Fisc Stud. 2020 Sep.

Abstract

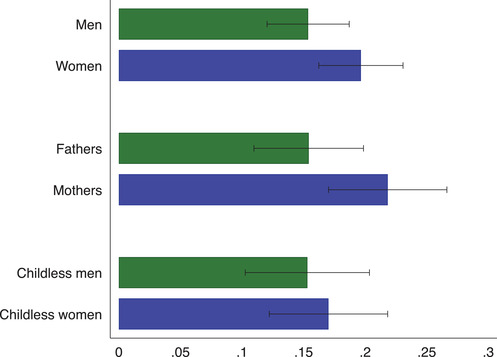
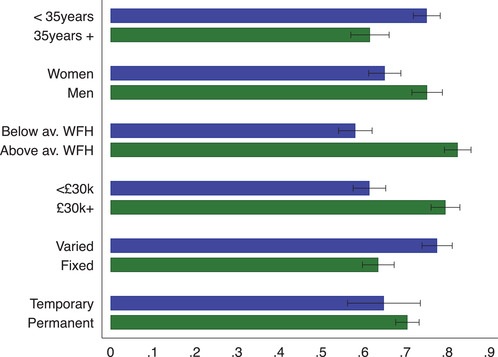
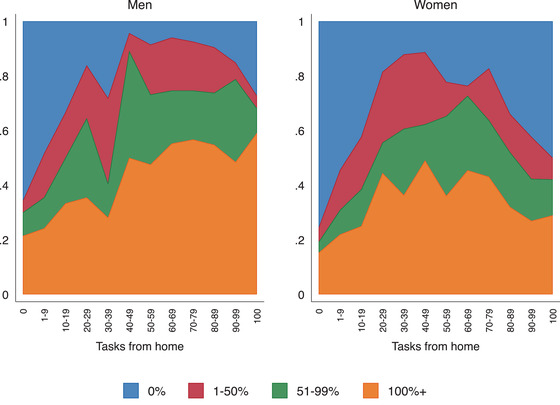
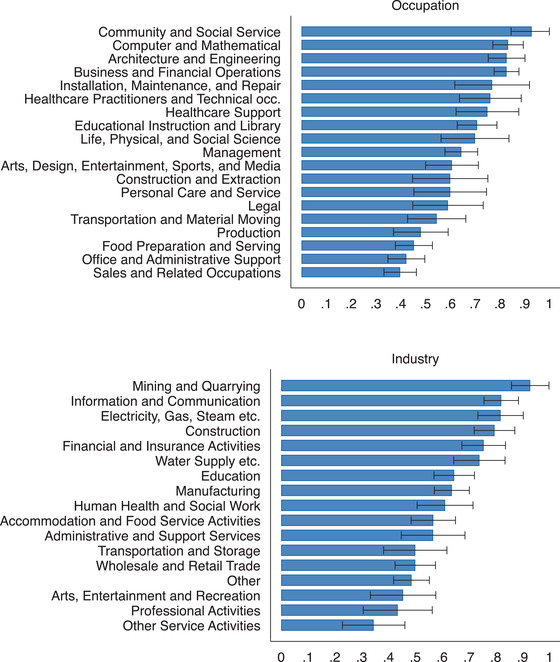
Over nine million jobs were furloughed in the United Kingdom during the coronavirus pandemic. Using real-time survey evidence from the UK in April and May 2020, we document which workers were most likely to be furloughed and we analyse variation in the terms on which they furloughed. We find that women were significantly more likely to be furloughed. Inequality in care responsibilities seems to have played a key role: mothers were 10 percentage points more likely than fathers to initiate the decision to be furloughed (as opposed to it being fully or mostly the employer's decision) but we find no such gender gap amongst childless workers. The prohibition of working whilst furloughed was routinely ignored, especially by men who can do a large percentage of their work tasks from home. Women were less likely to have their salary topped up beyond the 80 per cent subsidy paid for by the government. Considering the future, furloughed workers without employer-provided sick pay have a lower willingness to pay to return to work, as do those in sales and food preparation occupations. Compared with non-furloughed employees, furloughed workers are more pessimistic about keeping their job in the short to medium run and are more likely to be actively searching for a new job, even when controlling for detailed job characteristics. These results have important implications for the design of short-time work schemes and the strategy for effectively reopening the economy.

Keywords: COVID‐19; coronavirus; crisis; furlough; inequality; recession; short‐time work.


Figures

FIGURE 1
FIGURE 1
Share of furloughed workers by region Note: The horizontal bars show the average share of employees who were furloughed on the survey date for each region. The black bars represent 95 per cent confidence intervals. Survey responses for the April and May survey waves are pooled in this figure.
FIGURE 2
FIGURE 2
Share of furloughed workers by occupation and industry Note: The horizontal bars show the average share of employees who were furloughed on the survey date for each occupation (top) and industry (bottom). The black bars represent 95 per cent confidence intervals. Survey responses for the April and May survey waves are pooled in this figure.
FIGURE 3
FIGURE 3
Share of workers furloughed and share that have lost their job across occupations and industries Note: Each circle represents either an occupation or industry, with the size proportional to the number of survey respondents who report that either their current or last job was in that occupation or industry. The line gives the line of best fit. Survey responses for the April and May survey waves are pooled in this figure.
FIGURE 4
FIGURE 4
Share of furloughed workers by individual and job characteristics Note: The graph shows the share of workers that are currently furloughed by different individual and job characteristics. Black bars represent 95 per cent confidence intervals. Survey responses for the April and May survey waves are pooled in this figure. ‘Below av. WFH’ are employees who can do less than average tasks from home, while ‘Above av. WFH’ are employees who can do more than average tasks from home. ‘<£30k’ refers to respondents with a yearly gross individual income below £30,000 in 2019, while ‘£30k+’ refers to those earning more. ‘Varied’ refers to respondents with variable‐hour contracts, while ‘fixed’ refers to those with fixed‐hour contracts.
FIGURE 5
FIGURE 5
Share of furloughed employees who asked to be furloughed Note: The graph shows the share of currently furloughed employees who initiated furloughing. We construct a binary variable that takes the value of 1 if the respondent reports that they had an equal say in the furloughing decision, or the furloughing was initiated mostly or fully by them. Mothers or fathers are defined as respondents who have at least one child living in the household. The sample is restricted to respondents to the May survey wave.
FIGURE 6
FIGURE 6
Share of furloughed workers receiving top‐up by individual and job characteristics Note: The graph shows the share of workers that are currently furloughed by different individual and job characteristics who report having their salary topped up beyond the 80 per cent subsidy provided by the government. Black bars represent 95 per cent confidence intervals. The sample is restricted to respondents to the April survey wave. ‘Below av. WFH’ are employees who can do less than average tasks from home, while ‘Above av. WFH’ are employees who can do more than average tasks from home. ‘<£30k’ refers to respondents with a yearly gross individual income below £30,000 in 2019, while ‘£30k+’ are those earning more. ‘Varied’ refers to respondents with variable‐hour contracts, while ‘fixed’ refers to those with fixed‐hour contracts.
FIGURE 7
FIGURE 7
Percentage of usual hours worked while furloughed by the percentage of tasks that can be done from home Note: The graph shows the percentage of typical work hours worked in the previous week by respondents who are currently furloughed, by the percentage of tasks that can be done from home. Survey responses for the April and May survey waves are pooled in this figure.
FIGURE 8
FIGURE 8
Would accept pay cut to return to work, by occupation and industry Note: The graph shows the share of currently furloughed workers who would prefer to go back to work for 80 per cent of their salary instead of staying on furlough, by occupation and industry. Black bars represent 95 per cent confidence intervals. The sample is restricted to furloughed respondents of the May survey wave.

References

    1. Adams, A. (2020), ‘The gender wage gap on an online labour market: the cost of interruptions’, CEPR Discussion Paper No. 14294.
    1. Adams‐Prassl, A. , Boneva, T. , Golin, M. and Rauh, C. (2020a), ‘Inequality in the impact of the coronavirus shock: new survey evidence for the UK’, Cambridge‐INET Working Paper (10.17863/CAM.52477). - DOI
    1. Adams‐Prassl, A. , Boneva, T. , Golin, M. and Rauh, C. (2020b), ‘Work tasks that can be done from home: evidence on variation within and across occupations and industries’, IZA Discussion Paper No. 13374.
    1. Adams‐Prassl, A. , Boneva, T. , Golin, M. , and Rauh, C. (2020c), Inequality in the impact of the coronavirus shock: evidence from real time surveys. Journal of Public Economics, vol. 189, 104245.
    1. Alon, T. , Doepke, M. , Olmstead‐Rumsey, J. , and Tertilt, M. (2020), ‘The impact of COVID‐19 on gender equality’, National Bureau of Economic Research Working Paper No. 26947.

LinkOut - more resources