. 2020 Dec 1;32(12):125102.
doi: 10.1063/5.0033849.

The motion of respiratory droplets produced by coughing

The motion of respiratory droplets produced by coughing

Hongping Wang et al. Phys Fluids (1994). .

Abstract

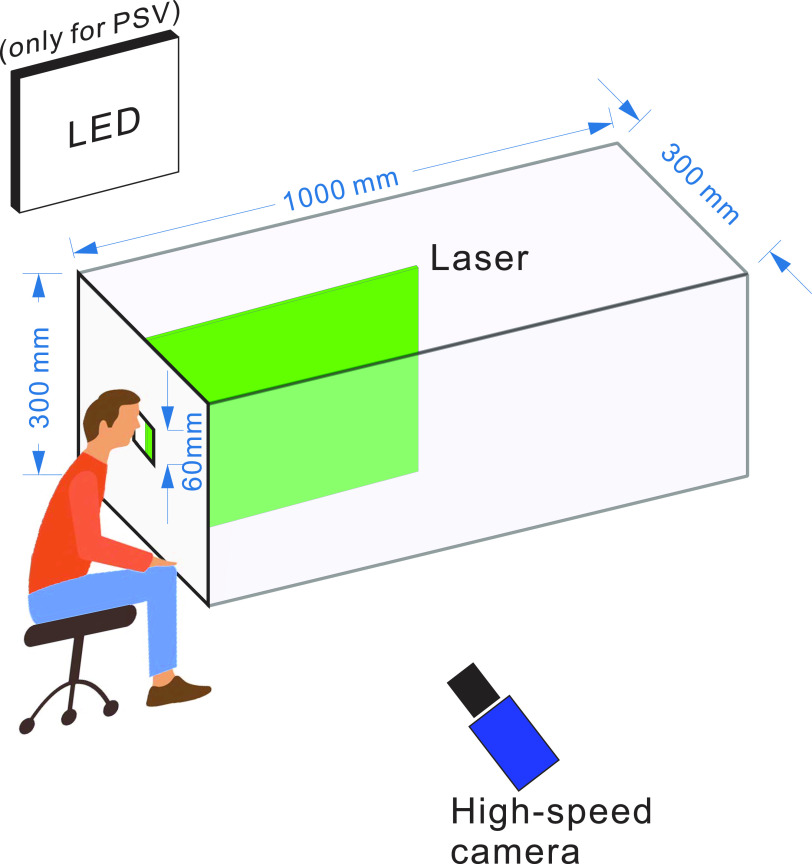
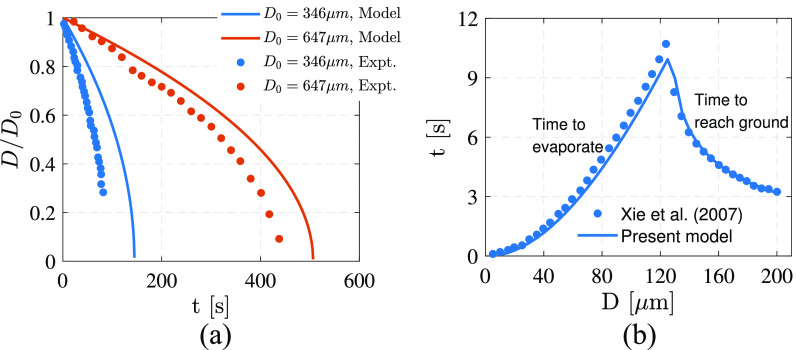
Coronavirus disease 2019 has become a global pandemic infectious respiratory disease with high mortality and infectiousness. This paper investigates respiratory droplet transmission, which is critical to understanding, modeling, and controlling epidemics. In the present work, we implemented flow visualization, particle image velocimetry, and particle shadow tracking velocimetry to measure the velocity of the airflow and droplets involved in coughing and then constructed a physical model considering the evaporation effect to predict the motion of droplets under different weather conditions. The experimental results indicate that the convection velocity of cough airflow presents the relationship t -0.7 with time; hence, the distance from the cougher increases by t 0.3 in the range of our measurement domain. Substituting these experimental results into the physical model reveals that small droplets (initial diameter D ≤ 100 μm) evaporate to droplet nuclei and that large droplets with D ≥ 500 μm and an initial velocity u 0 ≥ 5 m/s travel more than 2 m. Winter conditions of low temperature and high relative humidity can cause more droplets to settle to the ground, which may be a possible driver of a second pandemic wave in the autumn and winter seasons.


Figures

FIG. 1.
FIG. 1.
Schematic diagram of the experimental setup.
FIG. 2.
FIG. 2.
Illustrations of the droplet detection method used in the present work. (a) Part of the original image. (b) Image L obtained from the Laplacian of the Gaussian method. (c) Binary image of the connected regions. (d) Detected droplets. The gray contour lines correspond to the edges of the droplets, and the red dots correspond to the locations.
FIG. 3.
FIG. 3.
Example of the velocity vectors of expelled droplets.
FIG. 4.
FIG. 4.
Convection of smoke expelled by coughing. The image sequence shows a cough at intervals of 0.02 s. The red rectangles indicate the regions with higher gray levels, corresponding to concentrated smoke. The distance s is defined as the distance from the left origin to the right border of the rectangle, and w is the width of the box, as shown in the image of t = 0.041 s.
FIG. 5.
FIG. 5.
(a) Convection velocity Uc and distance s as a function of time t. (b) Relationship between the distance s and the width w of the cough jet. Open gray squares: original data averaged over 11 cases. Dashed lines: smoothed results. Solid lines: fitting results corresponding to the given formulas.
FIG. 6.
FIG. 6.
Average velocity fields from time t = 0 s to 0.01 s at intervals of 0.002 s.
FIG. 7.
FIG. 7.
(a) Velocity at position (x, y) = (0.02, 0) as a function of time. (b) Normalized axial mean velocity profiles at different streamwise positions of x = 0.02 m, 0.03 m, 0.04 m, 0.05 m, and 0.06 m.
FIG. 8.
FIG. 8.
(a) Flow rate Q as a function of time t and axial position x. (b) Time-averaged axial evolution of the flow rate Q.
FIG. 9.
FIG. 9.
(a) Average droplet velocity as a function of time. (b) Number of expelled droplets as a function of time in the measurement domain.
FIG. 10.
FIG. 10.
Joint probability density function (PDF) of the droplet velocity and diameter.
FIG. 11.
FIG. 11.
Trajectories of the droplets at five different diameters of D = 30 μm, 80 μm, 200 μm, 400 μm, and 800 μm (a) without considering the cough airflow and evaporation effect and (b) considering the cough airflow and the evaporation effect.
FIG. 12.
FIG. 12.
(a) Evaporation time and falling time as a function of the droplet diameter and initial velocity. (b) Distance traveled from the cougher (to evaporate to a small droplet with D = 5 μm or to fall to the ground) as a function of the droplet diameter and initial velocity. The distinction between the droplets that fall to the ground and those that evaporate to droplet nuclei is represented by a black dashed line, and the distinction between the droplets that evaporate in region A and those that evaporate in region B is denoted by a red dashed line.
FIG. 13.
FIG. 13.
Evaporation-falling times for different weather conditions.
FIG. 14.
FIG. 14.
Schematic diagram of droplet evaporation in air. The open and solid circles represent air and vapor, respectively.
FIG. 15.
FIG. 15.
(a) Comparison between the present model and the experimental results given by Chaudhuri et al. (2020). The diameter evolution of the motionless droplet is conducted at T = 30 °C and RH = 50%. D0 is the initial diameter of the droplet. (b) Comparison of the evaporation-falling time between the present model and the result extracted from the paper by Xie et al. (2007). The ambient temperature T is set to 18 °C, and the relative humidity RH is set to 0%. The droplet is released at a height of 2 m.

References

    1. Abuhegazy, M., Talaat, K., Anderoglu, O., and Poroseva, S. V., “Numerical investigation of aerosol transport in a classroom with relevance to COVID-19,” Phys. Fluids 32, 103311 (2020). 10.1063/5.0029118 - DOI - PMC - PubMed
    1. Agrawal, A. and Bhardwaj, R., “Reducing chances of COVID-19 infection by a cough cloud in a closed space,” Phys. Fluids 32, 101704 (2020). 10.1063/5.0029186 - DOI - PMC - PubMed
    1. Asadi, S., Bouvier, N., Wexler, A. S., and Ristenpart, W. D., “The coronavirus pandemic and aerosols: Does COVID-19 transmit via expiratory particles?” Aerosol Sci. Technol. 54, 635 (2020). 10.1080/02786826.2020.1749229 - DOI - PMC - PubMed
    1. Bourouiba, L., Dehandschoewercker, E., and Bush, J. W. M., “Violent expiratory events: On coughing and sneezing,” J. Fluid Mech. 745, 537–563 (2014). 10.1017/jfm.2014.88 - DOI
    1. Castanet, G., Dunand, P., Caballina, O., and Lemoine, F., “High-speed shadow imagery to characterize the size and velocity of the secondary droplets produced by drop impacts onto a heated surface,” Exp. Fluids 54, 1489 (2013). 10.1007/s00348-013-1489-3 - DOI

LinkOut - more resources