. 2020 Dec 10:14:606142.
doi: 10.3389/fncel.2020.606142. eCollection 2020.

Synaptic Vesicles Dynamics in Neocortical Epilepsy

Affiliations

Synaptic Vesicles Dynamics in Neocortical Epilepsy

Eleonora Vannini et al. Front Cell Neurosci. .

Abstract

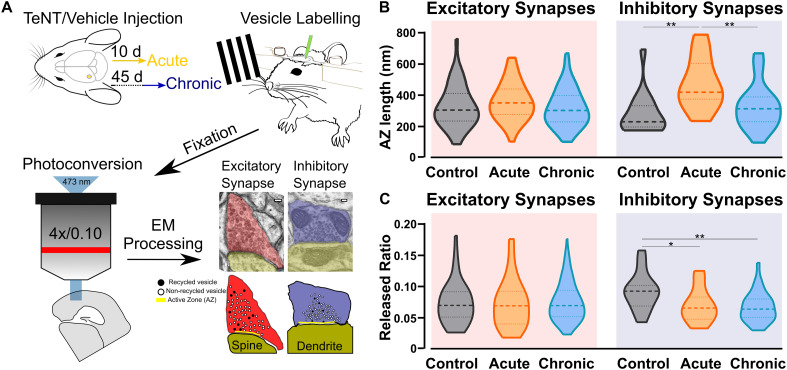
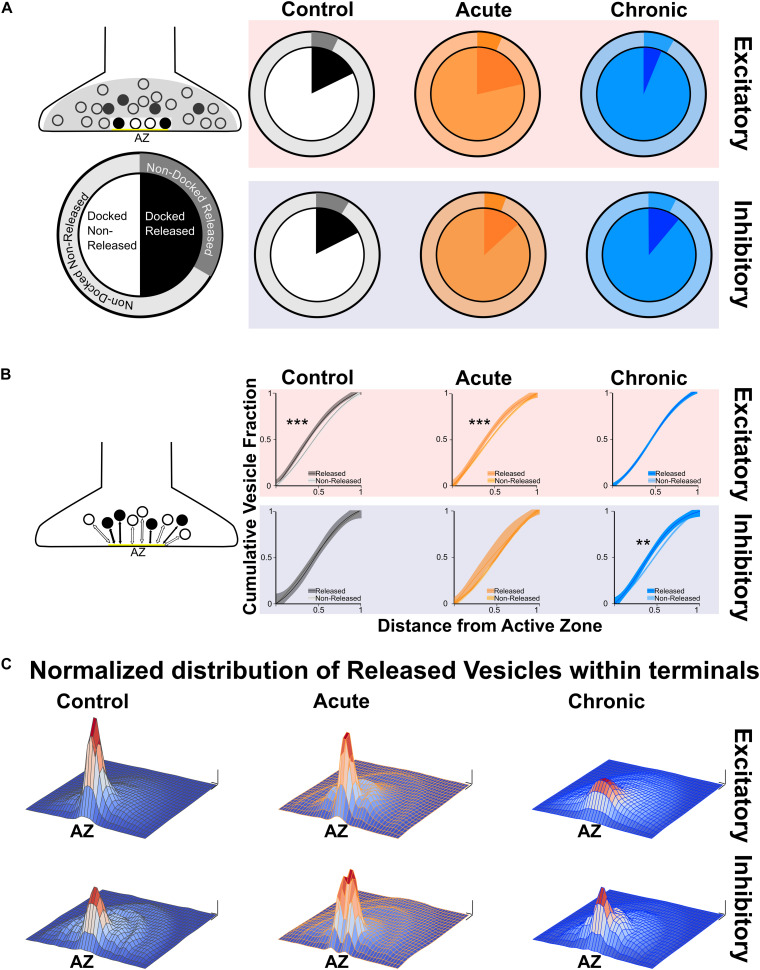
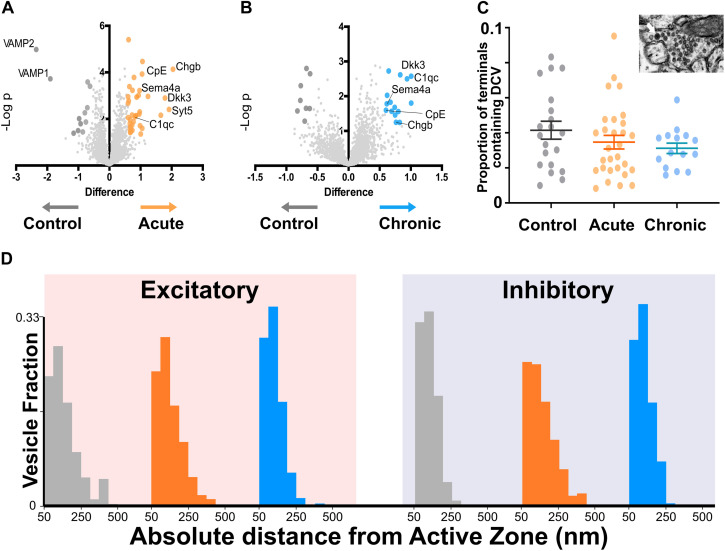
Neuronal hyperexcitability often results from an unbalance between excitatory and inhibitory neurotransmission, but the synaptic alterations leading to enhanced seizure propensity are only partly understood. Taking advantage of a mouse model of neocortical epilepsy, we used a combination of photoconversion and electron microscopy to assess changes in synaptic vesicles pools in vivo. Our analyses reveal that epileptic networks show an early onset lengthening of active zones at inhibitory synapses, together with a delayed spatial reorganization of recycled vesicles at excitatory synapses. Proteomics of synaptic content indicate that specific proteins were increased in epileptic mice. Altogether, our data reveal a complex landscape of nanoscale changes affecting the epileptic synaptic release machinery. In particular, our findings show that an altered positioning of release-competent vesicles represent a novel signature of epileptic networks.

Keywords: epilepsy; hyperexcitability; synaptic vesicles; tetanus neurotoxin; visual cortex; visual processing.


Conflict of interest statement

The authors declare that the research was conducted in the absence of any commercial or financial relationships that could be construed as a potential conflict of interest.

Figures

FIGURE 1
FIGURE 1
Ultrastructural and functional changes at presynaptic terminals of TeNT-injected mice. (A) Diagrammatic representation of labeling protocol. Visual cortices from mice in Control, Acute, and Chronic groups were infused with FM1-43FX during visual stimulation. Brains were rapidly fixed and sliced to allow photoconversion of FM1-43FX signal before processing for electron microscopy. Individual presynaptic terminals were classified as excitatory (asymmetrical synapses, red) or inhibitory (symmetrical synapses, blue); size, position and numbers of active zone (AZ, yellow), non-released vesicles (open circles) and released vesicles (black circles) were analyzed (scale bars 100 nm). (B) Left: Active zone (AZ) length in Control (gray), Acute (orange), and Chronic (blue) epileptic mice at excitatory synapses; no differences between the groups (Kruskal-Wallis test, p = 0.10). Distribution, median and quartiles shown for each group; Control n = 41; Acute n = 46; Chronic n = 118. Right: Active zone (AZ) length in Control (gray), Acute (orange), and Chronic (blue) epileptic mice at inhibitory synapses (Kruskal-Wallis test, p < 0.01, Control vs. Acute p < 0.01, Control vs. Chronic p > 0.05, Chronic vs. Acute p < 0.01). Distribution, median and quartiles shown for each group; Control n = 15; Acute n = 14; Chronic n = 29. (C) Left: Released fraction of synaptic vesicles (labeled vesicles/total vesicles) in Control (gray), Acute (orange), and Chronic (blue) epileptic mice at excitatory synapses; no differences between the groups (Kruskal-Wallis test, p = 0.67). Distribution, median, and quartiles shown for each group; Control n = 47; Acute n = 57; Chronic n = 118. Right: Released fraction of synaptic vesicles of Control (gray), Acute (orange), and Chronic (blue) epileptic mice at inhibitory synapses (Kruskal-Wallis test, p < 0.05, Control vs. Acute p < 0.05, Control vs. Chronic p < 0.01, Chronic vs. Acute p > 0.05). Distribution, median, and quartiles shown for each group; Control n = 16; Acute n = 16; Chronic n = 30.
FIGURE 2
FIGURE 2
Changes in released vesicles’ docking and spatial organization in chronic phase of epilepsy. (A) Ratio of released vesicles in the docked and undocked population. Left: Diagram and legend for each pie chart. Top: Excitatory synapses’ ratio of released vesicles (darker) in docked (inner pie chart) and undocked population (outer pie chart) in Control (gray), Acute (orange), and Chronic (blue) groups. Only the Chronic group shows a significant difference from expected frequencies based on control observation (Chi-squared test: p < 0.001). Bottom: Inhibitory synapses’ ratio of released vesicles (darker) in docked (inner pie chart) and undocked population (outer pie chart) in control (gray), acute (orange), and chronic (blue) groups. (B) Distance of released or non-released vesicles to the closest point on the active zone. Left: Diagram representing of how distance measures were taken at each synapse. Top: Sigmoid fit and 95% confidence interval of cumulative fraction of distance between released and not-released synaptic vesicles to the active zone at excitatory synapses in Control (gray), Acute (orange), and Chronic (blue) epileptic mice. Bottom: Sigmoid fit and 95% confidence interval of cumulative fraction of distance between released and not-released synaptic vesicles to the active zone at inhibitory synapses in Control (gray), Acute (orange), and Chronic (blue) epileptic mice. Paired t-test, Excitatory synapses: Control mice p = 0.0002 (n = 40), Acute mice p = 0.0006 (n = 41), Chronic mice p = 0.298 (n = 112). Paired t-test, Inhibitory synapses: Control mice p = 0.06 (n = 14), Acute mice p = 0.135 (n = 13), Chronic mice p = 0.001 (n = 28). (C) 2D histograms of released vesicles distribution at excitatory (top) and inhibitory (bottom) synapses across the three conditions with active zone at the origin of the XY plane. Control (gray), Acute (orange), and Chronic (blue). Each synapse was spatially normalized (X- and Y-axis) and frequency is plotted on the Z-axis. Scale bars: 0.1 normalized size X and Y; 0.1 fraction Z-axis.
FIGURE 3
FIGURE 3
Proteomics analysis of synaptosomes reveal an increase of proteins involved in vesicular positioning. (A,B) Differentially expressed proteins in Control vs. Acute (A) and Chronic epileptic phase (B). Volcano plots are built plotting average ratio of TeNT vs. corresponding control against their t-test log P-values; significance thresholds: FDR > 0.05 and fold change > 0.6. Proteins significantly upregulated in Acute and Chronic tetanic animals are highlighted, respectively, in orange and light blue; proteins significantly downregulated are in dark gray. Proteins abbreviations are Dkk3, Dickkopf-related protein 3; Sema4a, Semaphorin 4A; Cpe, carboxypeptidase e; Chgb, chromogranin b; Syt5, synaptotagmin5; VAMP1, Vesicle-associated membrane protein 1; VAMP2, Vesicle-associated membrane protein 2; C1qc, Complement C1q C Chain. (C) Proportion of presynaptic terminals containing Dense Core Vesicles in different non-overlapping sampled areas of Control (gray; n = 20), Acute (orange; n = 29), and Chronic (blue; n = 15) groups. No differences between groups (One Way ANOVA, p = 0.2869). Data are represented as mean ± SEM. Inset, a representative image of Dense Core Vesicles. (D) Right: Distribution of distances of non-released vesicles from active zone at excitatory synapses in Chronic (gray; n = 2140), Acute (orange; n = 2503), and Chronic (blue; n = 5705) groups (One-way ANOVA; F = 238.15, p < 0.0001, Control vs. Actute: p < 0.0001; Control vs. Chronic: p < 0.0001). Left: Distribution of distances of non-released vesicles from active zone at inhibitory synapses in Chronic (gray; n = 543), Acute (orange; n = 717), and Chronic (blue; n = 1520) groups (F = 75.57, p < 0.0001, Control vs. Actute: p < 0.0001; Control vs. Chronic: p > 0.05).
FIGURE 4
FIGURE 4
Acute inhibition of Carboxypeptidase (CPE) decreases hyperexcitability in TeNT-injected mice. (A) Left: diagram of experimental design: a 16-channel silicone probe was used to record LFP in different layers of the primary visual cortex, channels were analyzed in three groups according to their recording sites in relation to the surface of the cortex: the five most superficial, the five deepest, and the six intermediate channels. GEMSA was applied locally to inhibit CPE activity. Right: Examples of LFP traces obtained with a 16-channels probe from the visual cortex of an Acute epileptic mouse. (B) LFP traces of an Acute epileptic mouse before (baseline, top) and after GEMSA administration at two different time points: early (5–10 min) and late (10–20 min). (C) Coastline analysis of LFP signals recorded before (baseline) and after GEMSA administration at early and late time points. The analysis was differentially performed for superficial (left, red), intermediate (middle, green), and deep (right, blue) channels (Two-way ANOVA, Channel factor p > 0.05, Time factor p < 0.001; Baseline vs. Early: p < 0.01, Baseline vs. Late: p < 0.001, Early vs. Late: p < 0.001, n = 4). The mean, SEM, and value of individual recordings are shown for each group. ***p < 0.001.

References

    1. Bamji S. X., Rico B., Kimes N., Reichardt L. F. (2006). BDNF mobilizes synaptic vesicles and enhances synapse formation by disrupting cadherin-β-catenin interactions. J. Cell Biol. 174 289–299. 10.1083/jcb.200601087 - DOI - PMC - PubMed
    1. Bernard C. (2010). Alterations in synaptic function in epilepsy. Epilepsia 51:42 10.1111/j.1528-1167.2010.02828.x - DOI
    1. Bromfield E. B., Cavazos J. E. (2006). Basic Mechanisms Underlying Seizures and Epilepsy - An Introduction to Epilepsy - NCBI Bookshelf. Available online at: https://www.ncbi.nlm.nih.gov/books/NBK2510/ (accessed March 13, 2020)
    1. Chang B. L., Leite M., Snowball A., Lieb A., Chabrol E., Walker M. C., et al. (2018). Semiology, clustering, periodicity and natural history of seizures in an experimental occipital cortical epilepsy model. Dis. Model. Mech. 11:dmm036194. 10.1242/dmm.036194 - DOI - PMC - PubMed
    1. Clynen E., Swijsen A., Raijmakers M., Hoogland G., Rigo J. M. (2014). Neuropeptides as targets for the development of anticonvulsant drugs. Mol. Neurobiol. 50 626–646. 10.1007/s12035-014-8669-x - DOI - PMC - PubMed