

Neuromechanical Assessment of Activated vs. Resting Leg Rigidity Using the Pendulum Test Is Associated With a Fall History in People With Parkinson's Disease
- PMID: 33362496
- PMCID: PMC7756105
- DOI: 10.3389/fnhum.2020.602595
Neuromechanical Assessment of Activated vs. Resting Leg Rigidity Using the Pendulum Test Is Associated With a Fall History in People With Parkinson's Disease
Abstract
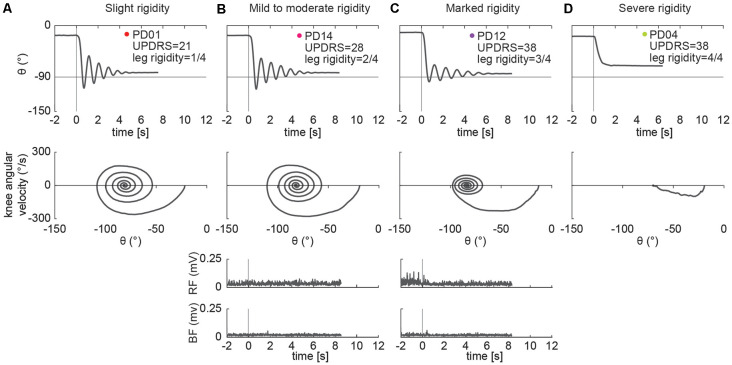
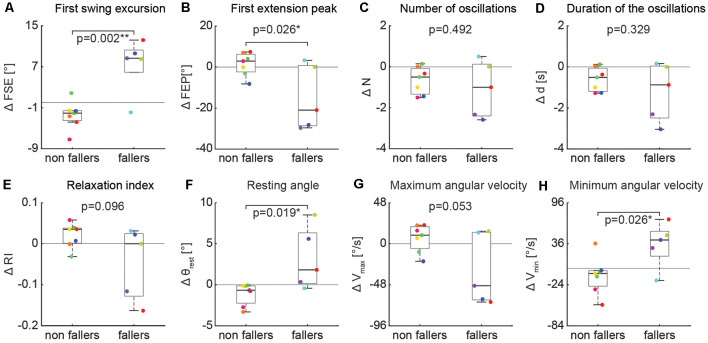
Leg rigidity is associated with frequent falls in people with Parkinson's disease (PD), suggesting a potential role in functional balance and gait impairments. Changes in the neural state due to secondary tasks, e.g., activation maneuvers, can exacerbate (or "activate") rigidity, possibly increasing the risk of falls. However, the subjective interpretation and coarse classification of the standard clinical rigidity scale has prohibited the systematic, objective assessment of resting and activated leg rigidity. The pendulum test is an objective diagnostic method that we hypothesized would be sensitive enough to characterize resting and activated leg rigidity. We recorded kinematic data and electromyographic signals from rectus femoris and biceps femoris during the pendulum test in 15 individuals with PD, spanning a range of leg rigidity severity. From the recorded data of leg swing kinematics, we measured biomechanical outcomes including first swing excursion, first extension peak, number and duration of the oscillations, resting angle, relaxation index, maximum and minimum angular velocity. We examined associations between biomechanical outcomes and clinical leg rigidity score. We evaluated the effect of increasing rigidity through activation maneuvers on biomechanical outcomes. Finally, we assessed whether either biomechanical outcomes or changes in outcomes with activation were associated with a fall history. Our results suggest that the biomechanical assessment of the pendulum test can objectively quantify parkinsonian leg rigidity. We found that the presence of high rigidity during clinical exam significantly impacted biomechanical outcomes, i.e., first extension peak, number of oscillations, relaxation index, and maximum angular velocity. No differences in the effect of activation maneuvers between groups with clinically assessed low rigidity were observed, suggesting that activated rigidity may be independent of resting rigidity and should be scored as independent variables. Moreover, we found that fall history was more common among people whose rigidity was increased with a secondary task, as measured by biomechanical outcomes. We conclude that different mechanisms contributing to resting and activated rigidity may play an important yet unexplored functional role in balance impairments. The pendulum test may contribute to a better understanding of fundamental mechanisms underlying motor symptoms in PD, evaluating the efficacy of treatments, and predicting the risk of falls.
Keywords: EMG; activation maneuver; biomechanics; dual-task; hyper-resistance; hyperreflexia; kinematics; neural control.
Copyright © 2020 Martino, McKay, Factor and Ting.
Conflict of interest statement
The authors declare that the research was conducted in the absence of any commercial or financial relationships that could be construed as a potential conflict of interest.
Figures


Similar articles
-
Interaction between muscle tone, short-range stiffness and increased sensory feedback gains explains key kinematic features of the pendulum test in spastic cerebral palsy: A simulation study.PLoS One. 2018 Oct 18;13(10):e0205763. doi: 10.1371/journal.pone.0205763. eCollection 2018. PLoS One. 2018. PMID: 30335860 Free PMC article.
-
Amplitude and velocity dependence of patellar pendulum triggered by T reflex in Parkinson's rigidity.Neurol Sci. 2021 Aug;42(8):3257-3266. doi: 10.1007/s10072-020-04936-y. Epub 2020 Nov 27. Neurol Sci. 2021. PMID: 33247322
-
Movement History Influences Pendulum Test Kinematics in Children With Spastic Cerebral Palsy.Front Bioeng Biotechnol. 2020 Aug 7;8:920. doi: 10.3389/fbioe.2020.00920. eCollection 2020. Front Bioeng Biotechnol. 2020. PMID: 32850754 Free PMC article.
-
Lower Limb Rigidity Is Associated with Frequent Falls in Parkinson's Disease.Mov Disord Clin Pract. 2019 Jun 6;6(6):446-451. doi: 10.1002/mdc3.12784. eCollection 2019 Jul. Mov Disord Clin Pract. 2019. PMID: 31392245 Free PMC article.
-
Contributions to the understanding of gait control.Dan Med J. 2014 Apr;61(4):B4823. Dan Med J. 2014. PMID: 24814597 Review.
Cited by
-
Exoskeletons need to react faster than physiological responses to improve standing balance.Sci Robot. 2023 Feb 22;8(75):eadf1080. doi: 10.1126/scirobotics.adf1080. Epub 2023 Feb 15. Sci Robot. 2023. PMID: 36791215 Free PMC article.
References
-
- Andreeva Y., Khutorskaya O. (1996). Application EMGs spectral analysis method for the objective diagnosis of different clinical forms of Parkinson’s disease. Electromyogr. Clin. Neurophysiol. 36, 187–192. - PubMed
-
- Bianchi L., Monaldi F., Paolucci S., Iani C., Lacquaniti F. (1999). Quantitative analysis of the pendulum test: application to multiple sclerosis patients treated with botulinum toxin. Funct. Neurol. 14, 79–92. - PubMed
-
- Brown R. A., Lawson D. A., Leslie G. C., MacArthur A., MacLennan W. J., McMurdo M. E., et al. . (1988). Does the Wartenberg pendulum test differentiate quantitatively between spasticity and rigidity? A study in elderly stroke and Parkinsonian patients. J. Neurol. Neurosurg. Psychiatry 51, 1178–1186. 10.1136/jnnp.51.9.1178 - DOI - PMC - PubMed
Grants and funding
LinkOut - more resources
Full Text Sources