. 2020 Dec 3:11:578346.
doi: 10.3389/fphar.2020.578346. eCollection 2020.

A Mass Spectrometry Based Metabolite Profiling Workflow for Selecting Abundant Specific Markers and Their Structurally Related Multi-Component Signatures in Traditional Chinese Medicine Multi-Herb Formulae

Affiliations

A Mass Spectrometry Based Metabolite Profiling Workflow for Selecting Abundant Specific Markers and Their Structurally Related Multi-Component Signatures in Traditional Chinese Medicine Multi-Herb Formulae

Joëlle Houriet et al. Front Pharmacol. .

Abstract

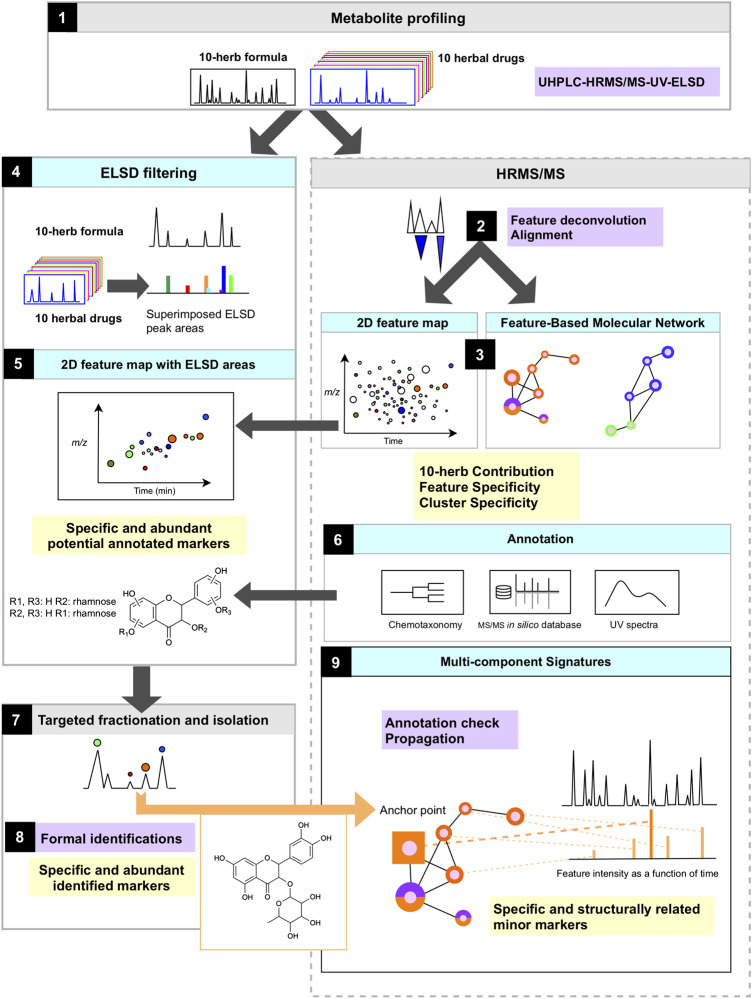
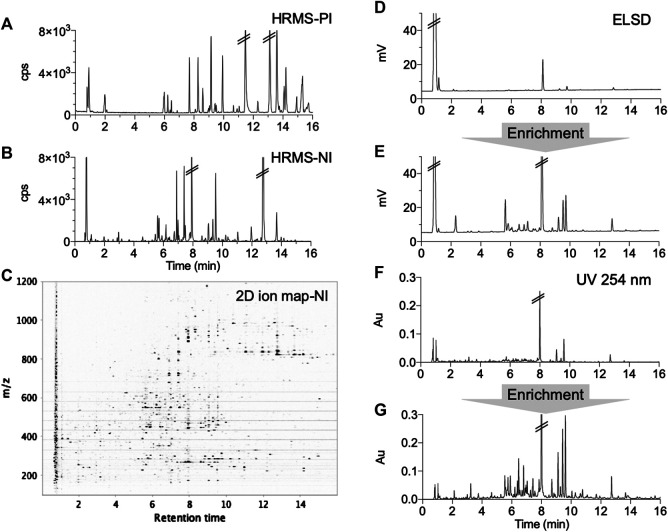
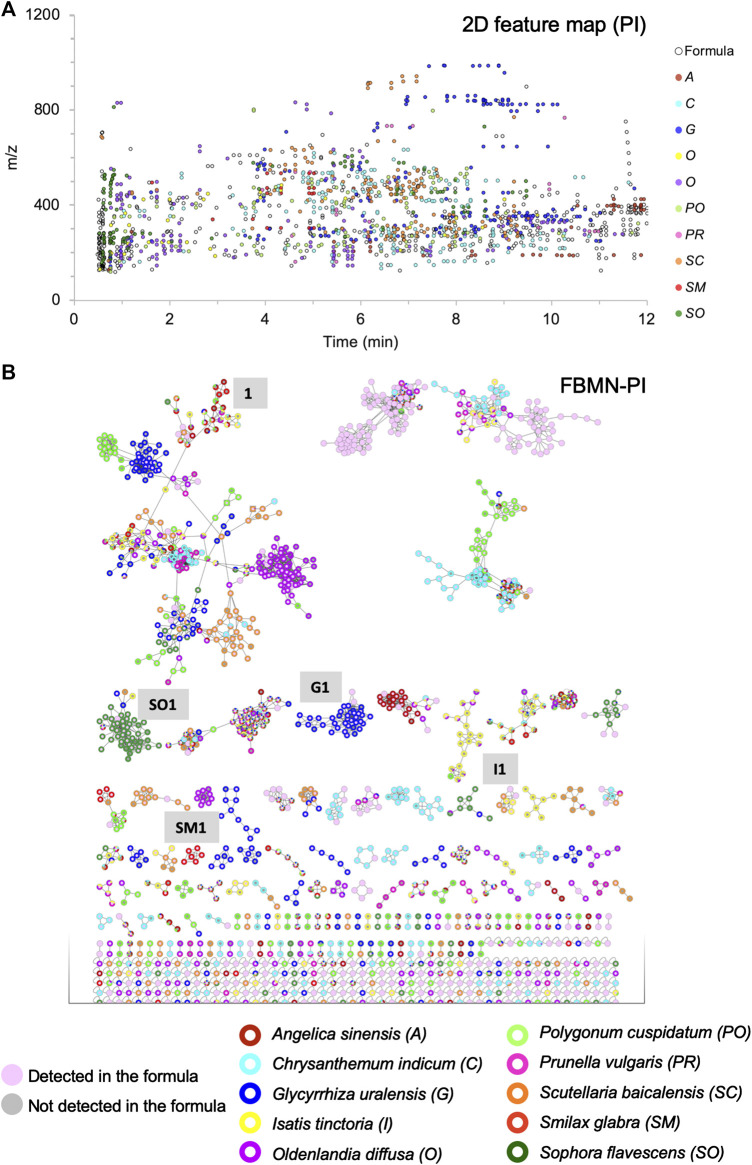
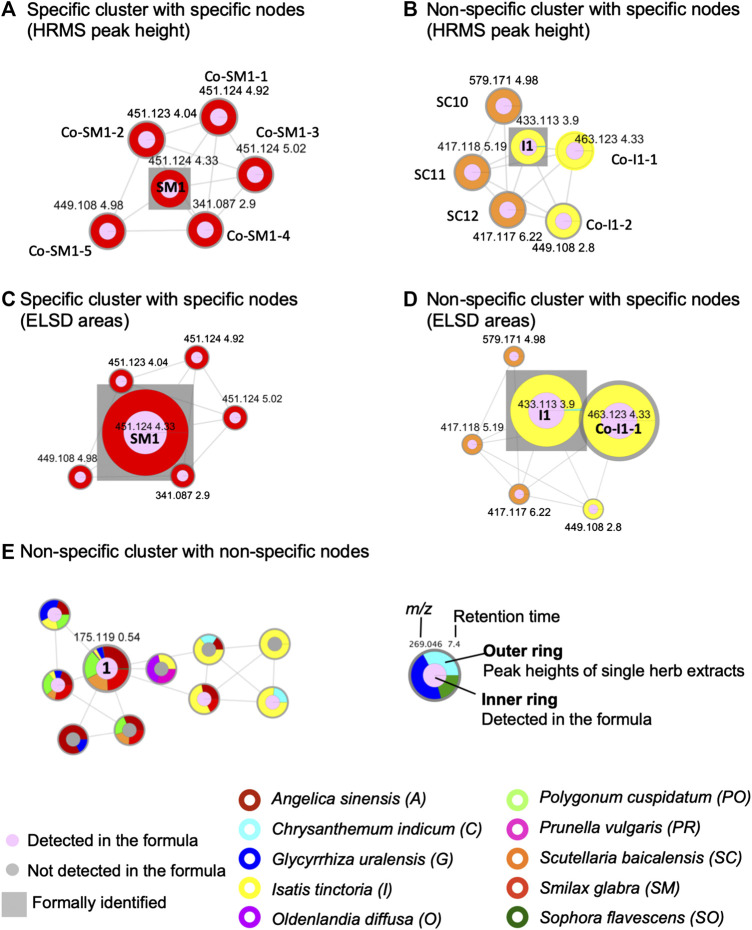
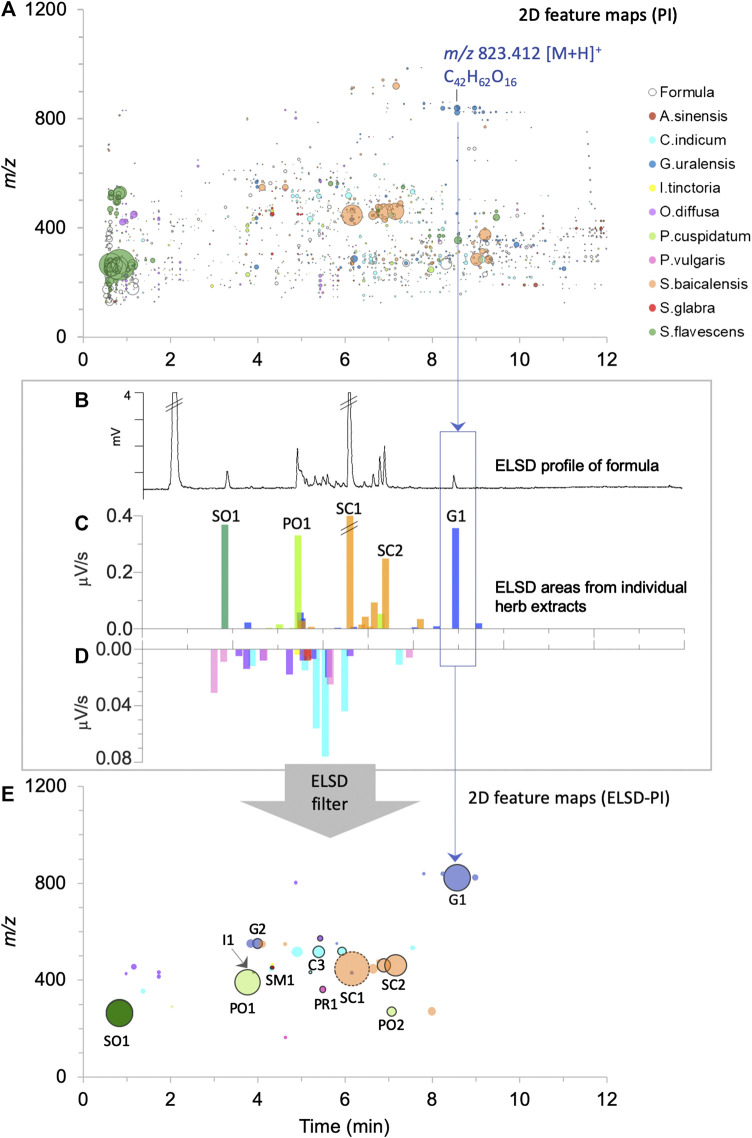
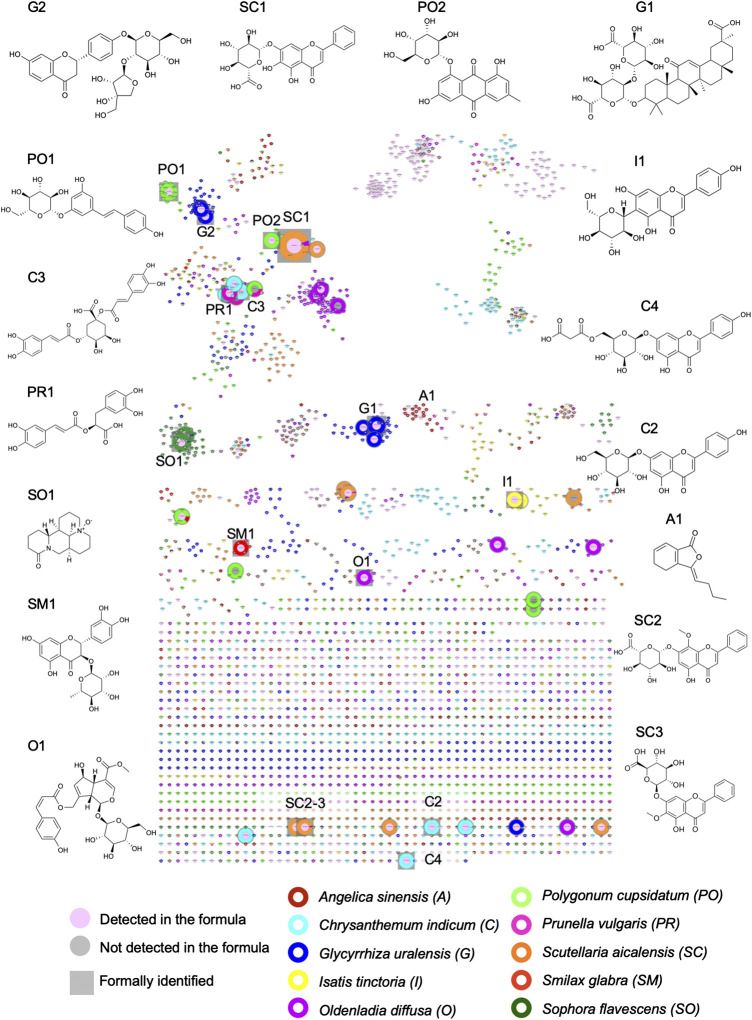
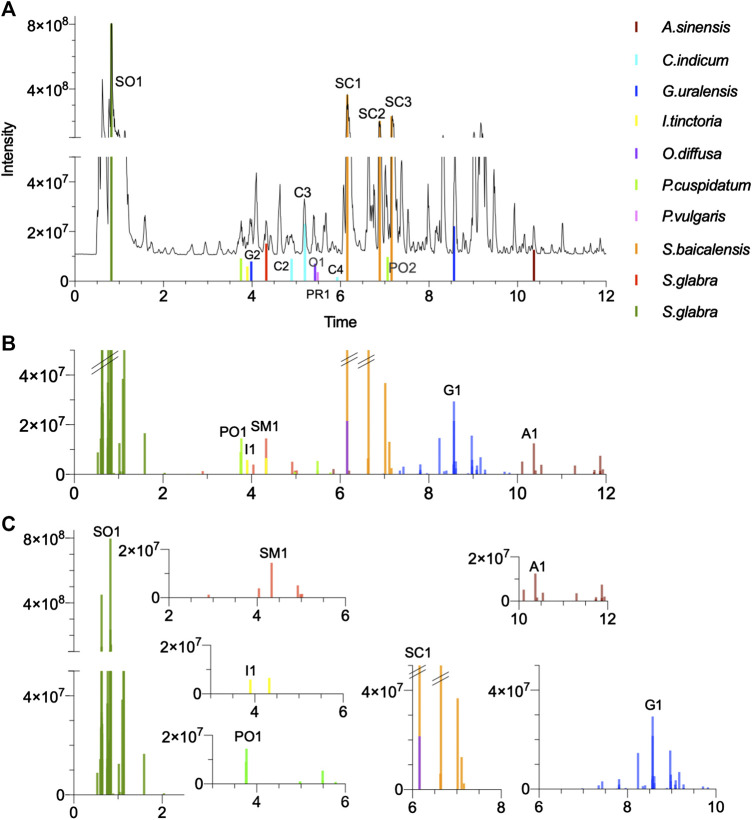
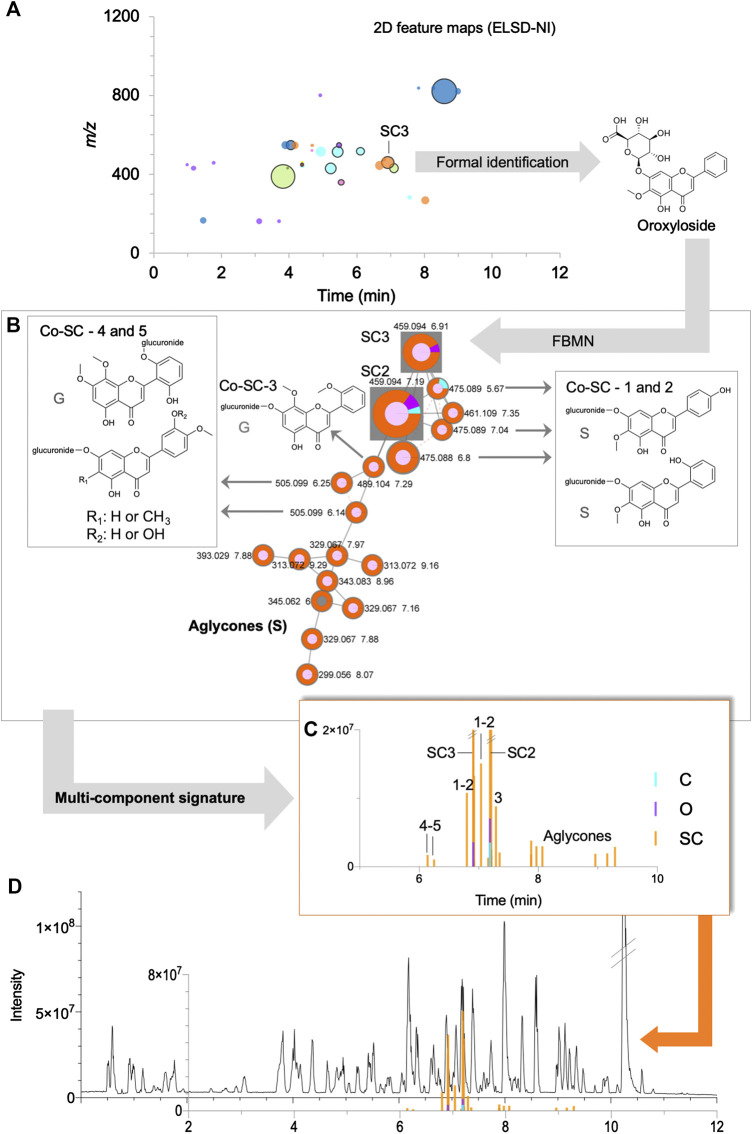
In Traditional Chinese Medicine (TCM), herbal preparations often consist of a mixture of herbs. Their quality control is challenging because every single herb contains hundreds of components (secondary metabolites). A typical 10 herb TCM formula was selected to develop an innovative strategy for its comprehensive chemical characterization and to study the specific contribution of each herb to the formula in an exploratory manner. Metabolite profiling of the TCM formula and the extract of each single herb were acquired with liquid chromatography coupled to high-resolution mass spectrometry for qualitative analyses, and to evaporative light scattering detection (ELSD) for semi-quantitative evaluation. The acquired data were organized as a feature-based molecular network (FBMN) which provided a comprehensive view of all types of secondary metabolites and their occurrence in the formula and all single herbs. These features were annotated by combining MS/MS-based in silico spectral match, manual evaluation of the structural consistency in the FBMN clusters, and taxonomy information. ELSD detection was used as a filter to select the most abundant features. At least one marker per herb was highlighted based on its specificity and abundance. A single large-scale fractionation from the enriched formula enabled the isolation and formal identification of most of them. The obtained markers allowed an improved annotation of associated features by manually propagating this information through the FBMN. These data were incorporated in the high-resolution metabolite profiling of the formula, which highlighted specific series of related components to each individual herb markers. These series of components, named multi-component signatures, may serve to improve the traceability of each herb in the formula. Altogether, the strategy provided highly informative compositional data of the TCM formula and detailed visualizations of the contribution of each herb by FBMN, filtered feature maps, and reconstituted chromatogram traces of all components linked to each specific marker. This comprehensive MS-based analytical workflow allowed a generic and unbiased selection of specific and abundant markers and the identification of multiple related sub-markers. This exploratory approach could serve as a starting point to develop more simple and targeted quality control methods with adapted marker specificity selection criteria to given TCM formula.

Keywords: Traditional Chinese Medicine; feature-based molecular network; multi-component signature, TCM, Mass spectrometry, Chemical markers; multi-herb formulae; quality control.


Conflict of interest statement

The authors declare that the research was conducted in the absence of any commercial or financial relationships that could be construed as a potential conflict of interest.

Figures

FIGURE 1
FIGURE 1
Scheme of the study workflow and analytical strategy to evaluate the metabolome contribution of each herb, identify specific markers of the formula and establish multi-component signature of each herb.
FIGURE 2
FIGURE 2
UHPLC metabolite profiling of the formula with different detections before and after enrichment: (A,B) complementary positive (PI) and negative (NI) ionization chromatograms, (C) 2D ion map presenting all ions detected in NI, (D,E) ELSD chromatograms before and after SPE enrichment showing the unretained polar metabolites (mainly saccharides), (F,G) UV chromatograms (254 nm) before and after enrichment.
FIGURE 3
FIGURE 3
Visualization of the contribution of the 10 herbs to the formula, in which each herb is represented by a different color: (A) 2D feature map in PI: each black circle represents a feature detected in the formula, the size of the circles is fixed and equal for all features. The inner color of the circle indicates that the feature is specifically detected in one of the 10 herbs (90% specificity threshold). (B) FBMN in PI for the organization of the MS/MS spectra of all features presented in (A), with the same color coding and fixed node size.
FIGURE 4
FIGURE 4
Selected examples of cluster and node specificity in the FBMN-PI: (A) specific cluster for S. glabra (100%) exhibiting only specific nodes (the size node is proportional to the HRMS height of the peak), (B) non-specific cluster (50% S. baicalensis and 50% I. tinctoria), with nodes each specific to one single herb (specific components of each herb sharing common structural type for both herbs) (the size node is proportional to the HRMS height of the peak), (C) the same cluster as in (A) with the node sizes proportional to the ELSD areas, (D) the same cluster as in (B) with the node sizes proportional to the ELSD areas, (E) non-specific cluster common to several herbs with a node annotated as an ubiquitous component, arginine (1) (the node size is proportional to the HRMS height of the peak). For arginine (1), the colors shows the following specificity percentage: A. sinensis 28%, G. uralensis 5%, I. tinctoria 3%, O. diffusa 1%, P. cuspidatum 21%, S. baicalensis 18%, S. glabra 24%, S. flavescens 1%) (the size node is proportional to the HRMS height of the peak). Each herb is represented by a different color on the external ring. On the nodes, the numbers indicate feature m/z and retention time. The square is used to label formally identified components. Codes such as Co-Sm1-2 or SC10 referred to annotations, see Supplementary Tables S5, S9, S10.
FIGURE 5
FIGURE 5
Visualization of the contribution of the 10 herbs to the formula normalized by ELSD filtering to consider semi-quantitative relationship between components. Each herb is represented by a different color as in Figures 3, 4: (A) 2D feature map in PI: the size of the circles is proportional to the feature height intensity in the formula, only features detected in the formula are represented. The inner coloration of the circles indicates that the feature is specifically detected in one of the 10 herbs (90% specific threshold), (B) ELSD profile of the formula, (C,D) bar plots proportional to the chromatogram retention time dimension with superimposed ELSD areas of the individual herb extracts, presented in two scales, from 0 to 0.4 μV/s in (C) and from 0 to 0.08 μV/s in (D). (E) 2D feature map (PI) presenting the features to which ELSD peaks were assigned. The size of the dots is proportional to ELSD areas, with the exception of the dot with a dashed circle (SC1), where half of the area value is shown to improve visualization (very major component). The dots with a black outer circle represented components that have been formally identified.
FIGURE 6
FIGURE 6
Visualization of the ELSD detected peaks in the FBMN-PI and structures of all formally identified components. In this representation of the FBMN, the size of the nodes is proportional to ELSD areas. See Table 4 for the name of the components.
FIGURE 7
FIGURE 7
Multi-component signatures extracted from the FBMN (Figures 3B, 6) and represented in the form of bar chromatograms presenting the feature height intensity as a function of retention time in PI: (A) metabolite profile of the formula showing all formally identified components, (B) bar chromatograms showing seven multi-component signatures. (C) multicomponent signatures for S. glabra and its marker astilbin (SM1), I. tinctoria and isovitexin (I1), P. cuspidatum and E-piceid (PO1), A. sinensis and ligustilide (A1), G. uralensis and uralsaponin A (G1), S. flavescens and oxymatrine (SO1) and S. baicalensis and baicalin (SC1). All X axes represent time dimension, all Y axes feature height intensity. See Supplementary Tables S2–S11 for annotations.
FIGURE 8
FIGURE 8
Example of the detailed mining of a multi-component signature for Scutellaria baicalensis in the formula: (A) 2D feature map (NI) filtered by ELSD (see Figure 5E), (B) specific cluster in FBMN-NI containing the identified markers SC2 and SC3 and their related annotated nodes, some with structures described for the species (S) or genus (G), (C) bar chromatograms showing the corresponding multi-component signature with their chromatographic data, (D) UHPLC-HRMS/MS metabolite profile of the formula in NI in regards of the multi-component signature. Codes such as Co-SC-2 referred to annotations, see Supplementary Table S9.

References

    1. Abdel-Aziz H., Kelber O., Lorkowski G., Storr M. (2017). Evaluating the multitarget effects of combinations through multistep clustering of pharmacological data: the example of the commercial preparation Iberogast. Planta Med. 83 (14/15), 1130–1140. 10.1055/s-0043-116852 - DOI - PMC - PubMed
    1. Abdel-Tawab M. (2018). Do we need plant food supplements? A critical examination of quality, safety, efficacy, and necessity for a new regulatory framework. Planta Med. 84 (6-7), 372–393. 10.1055/s-0043-123764 - DOI - PubMed
    1. Afzan A., Wolfender J.-L., Afzan A., Kasim N., Ismail Nor H., Azmi N., et al. (2019). Differentiation of Ficus deltoidea varieties and chemical marker determination by UHPLC-TOFMS metabolomics for establishing quality control criteria of this popular Malaysian medicinal herb. Metabolomics 15 (3), 35 10.1007/s11306-019-1489-2 - DOI - PubMed
    1. Allard P.-M., Peresse T., Bisson J., Gindro K., Marcourt L., Pham V. C., et al. (2016). Integration of molecular networking and in-silico MS/MS fragmentation for natural products dereplication. Anal. Chem. 88 (6), 3317–3323. 10.1021/acs.analchem.5b04804 - DOI - PubMed
    1. Bai Y., Xia B., Xie W., Zhou Y., Xie J., Li H., et al. (2016). Phytochemistry and pharmacological activities of the genus Prunella. Food Chem. 204, 483–496. 10.1016/j.foodchem.2016.02.047 - DOI - PubMed

LinkOut - more resources