. 2020 Dec 10:11:604069.
doi: 10.3389/fphys.2020.604069. eCollection 2020.

Mitochondrial Fission and Mitophagy Coordinately Restrict High Glucose Toxicity in Cardiomyocytes

Affiliations

Mitochondrial Fission and Mitophagy Coordinately Restrict High Glucose Toxicity in Cardiomyocytes

Satoru Kobayashi et al. Front Physiol. .

Abstract

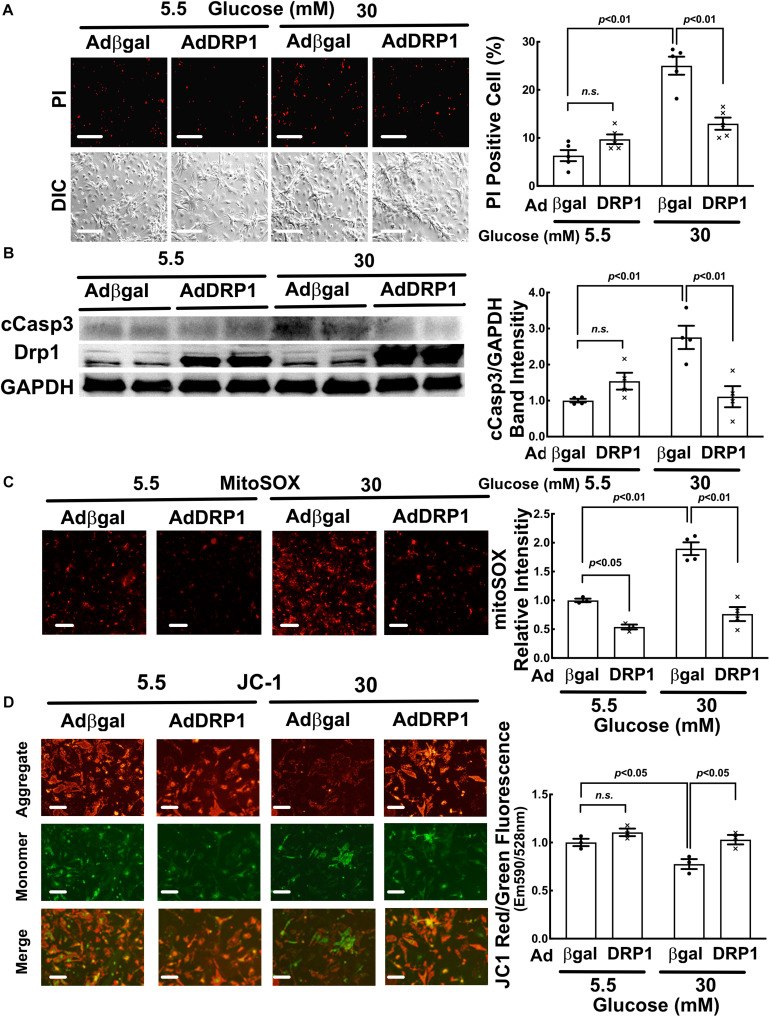
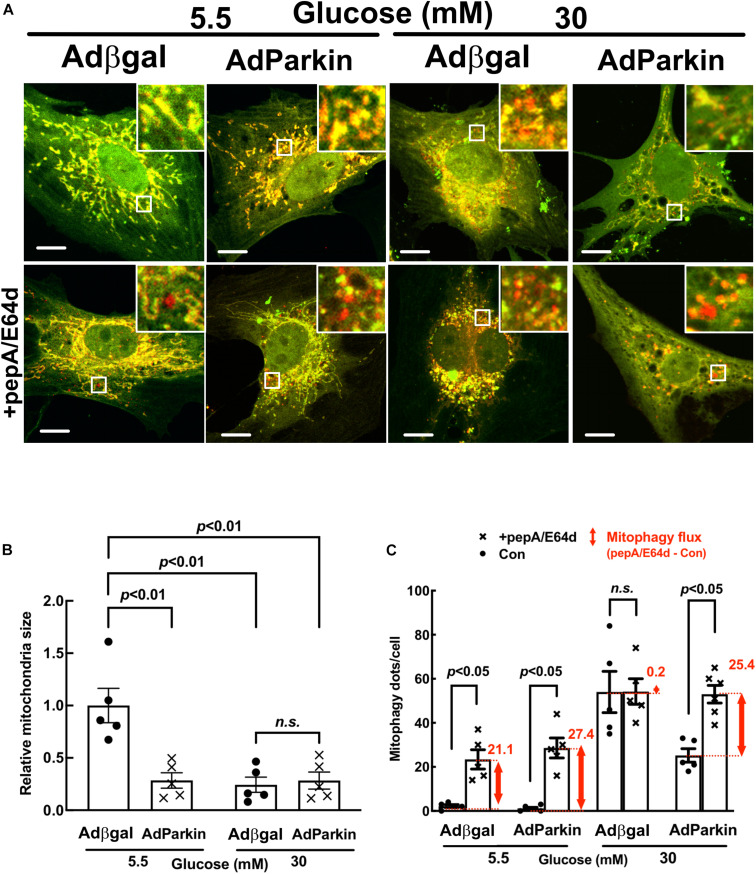
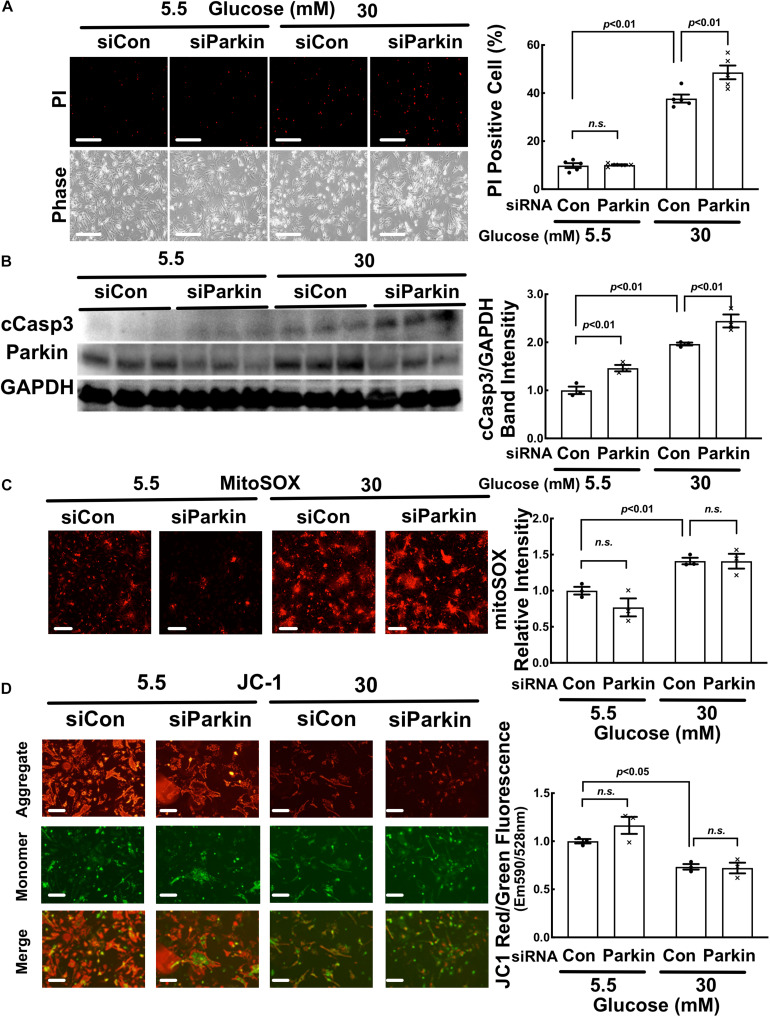
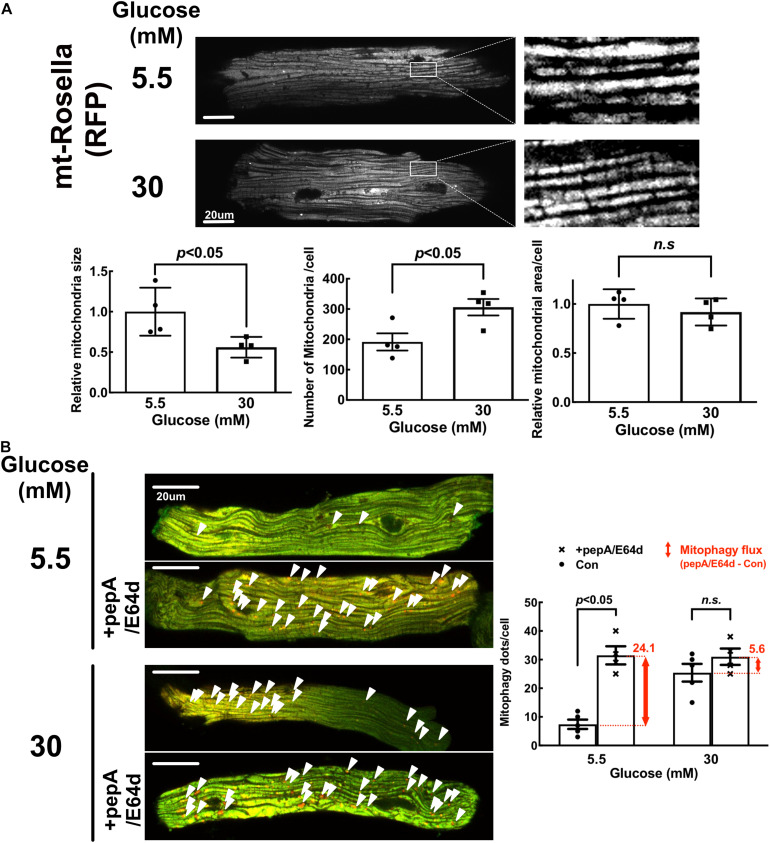
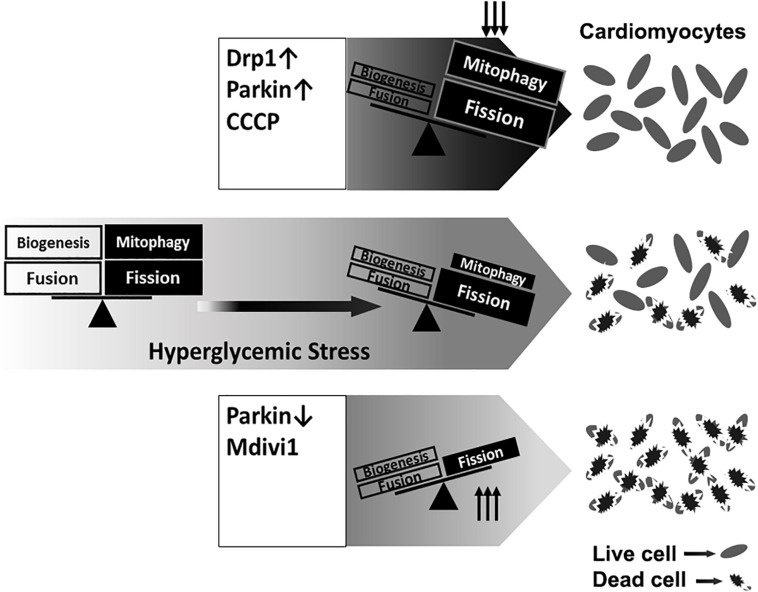
Hyperglycemia-induced mitochondrial dysfunction plays a key role in the pathogenesis of diabetic cardiomyopathy. Injured mitochondrial segments are separated by mitochondrial fission and eliminated by autophagic sequestration and subsequent degradation in the lysosome, a process termed mitophagy. However, it remains poorly understood how high glucose affects the activities of, and the relationship between, mitochondrial fission and mitophagy in cardiomyocytes. In this study, we determined the functional roles of mitochondrial fission and mitophagy in hyperglycemia-induced cardiomyocyte injury. High glucose (30 mM, HG) reduced mitochondrial connectivity and particle size and increased mitochondrial number in neonatal rat ventricular cardiomyocytes, suggesting an enhanced mitochondrial fragmentation. SiRNA knockdown of the pro-fission factor dynamin-related protein 1 (DRP1) restored mitochondrial size but did not affect HG toxicity, and Mdivi-1, a DRP1 inhibitor, even increased HG-induced cardiomyocyte injury, as shown by superoxide production, mitochondrial membrane potential and cell death. However, DRP1 overexpression triggered mitochondrial fragmentation and mitigated HG-induced cardiomyocyte injury, suggesting that the increased mitochondrial fission is beneficial, rather than detrimental, to cardiomyocytes cultured under HG conditions. This is in contrast to the prevailing hypothesis that mitochondrial fragmentation mediates or contributes to HG cardiotoxicity. Meanwhile, HG reduced mitophagy flux as determined by the difference in the levels of mitochondria-associated LC3-II or the numbers of mitophagy foci indicated by the novel dual fluorescent reporter mt-Rosella in the absence and presence of the lysosomal inhibitors. The ability of HG to induce mitochondrial fragmentation and inhibit mitophagy was reproduced in adult mouse cardiomyocytes. Overexpression of Parkin, a positive regulator of mitophagy, or treatment with CCCP, a mitochondrial uncoupler, induced mitophagy and attenuated HG-induced cardiomyocyte death, while Parkin knockdown had opposite effects, suggesting an essential role of mitophagy in cardiomyocyte survival under HG conditions. Strikingly, Parkin overexpression increased mitochondrial fragmentation, while DRP1 overexpression accelerated mitophagy flux, demonstrating a reciprocal activation loop that controls mitochondrial fission and mitophagy. Thus, strategies that promote the mutual positive interaction between mitochondrial fission and mitophagy while simultaneously maintain their levels within the physiological range would be expected to improve mitochondrial health, alleviating hyperglycemic cardiotoxicity.

Keywords: DRP1; Parkin; cardiomyocytes; cell death; diabetes; hyperglycemia; mitochondrial fission; mitophagy.


Conflict of interest statement

The authors declare that the research was conducted in the absence of any commercial or financial relationships that could be construed as a potential conflict of interest.

Figures

FIGURE 1
FIGURE 1
High glucose induces mitochondrial fragmentation in cardiomyocytes. NRVCs were cultured in DMEM with 5.5 or 30 mM glucose for 72 h. Mitochondrial structure was visualized by staining with MitoTracker Green (live cells, panel A) or dual fluorescence mt-Rosella mitophagy reporter (fixed cells, panel B). The confocal images of MitoTracker and mt-Rosella were analyzed with ImageJ. After image optimization, mitochondrial morphology was analyzed and average particle size (A,B), mitochondrial numbers (C) and total areas (D) were quantified. At least five images (each containing 5–8 cells) were captured per treatment. The scale bars = 10 μm (A) and 20 μm (B). Data are expressed as mean ± SEM and analyzed by using unpaired student t-test (p < 0.01 vs. 5.5 mM glucose, n = 6–8).
FIGURE 2
FIGURE 2
Moderate DRP1 knockdown did not affect high glucose-induced cardiomyocyte injury. NRVCs were transfected with scrambled control or DRP1-targeted synthetic siRNA, cultured with DMEM containing 5.5 or 30 mM glucose for 72 h, and then cardiomyocyte injury was determined by the number of PI positive cells (A: p > 0.05, n = 5), the levels of cCasp3 (B: cCasp3, p > 0.05, n = 4), superoxide production (C: MitoSOX, p > 0.05, n = 3–4) and mitochondrial membrane potential (D: ΔΨm, JC-1, p > 0.05, n = 3). Data were expressed as mean ± SEM and analyzed by two-way ANOVA. Scale bars represent (A) 200 μm, (C) 200 μm, (D) 100 μm, respectively.
FIGURE 3
FIGURE 3
DRP1 knockdown reduced basal mitochondrial fission and mitophagy flux in cardiomyocytes. NRVCs were infected with Admt-Rosella, transfected with scrambled control or DRP1-targeted synthetic siRNA, and then cultured with DMEM containing 5.5 or 30 mM glucose for 72 h. Mitochondrial morphology was observed with confocal microscopy and the merged confocal images (A) were analyzed using ImageJ. The relative mitochondrial sizes (B) and the number of mitophagy foci (red puncta or dots, C) in each cell were obtained by particle analysis measurements. At least five images (each containing between 5 and 8 cells) were captured per treatment. Scale bar = 20 μm. Experiments were repeated with addition of lysosomal inhibitors (PepA and E64D). Mitophagy flux was calculated by subtracting the mean of red puncta without inhibitors from the corresponding mean value of red puncta with inhibitors, which was denoted by the red number and the red vertical line with arrows at both ends in the bar graphs. Data were expressed as mean ± SEM and analyzed by two-way ANOVA (n = 5 for each group with p values indicated in the graphs).
FIGURE 4
FIGURE 4
DRP1 overexpression triggered mitochondrial fission, increased basal mitophagy and alleviated the inhibition of mitophagy flux by high glucose (HG). NRVCs were infected with AdDRP1 or Adβgal and cultured with DMEM containing 5.5 or 30 mM glucose for 72 h. Mitochondrial morphology was examined with confocal microscopy and the merged confocal images (A) were analyzed using ImageJ. The relative mitochondrial sizes (B) and the number of mitophagy foci (red puncta or dots, C) in each cell were obtained by particle analysis measurements. At least five images (each containing between 5 and 8 cells) were captured per treatment. Scale bar = 20 μm. Mitophagy flux was measured with and without PepA and E64D, and denoted by the red number and the red vertical line with arrows at both ends in the bar graphs. Data were expressed as mean ± SEM and analyzed by two-way ANOVA (n = 5 for each group with p values indicated in the graphs).
FIGURE 5
FIGURE 5
DRP1 overexpression alleviated high glucose-induced cardiomyocytes injury. NRVCs were infected with AdDRP1 or Adβgal and cultured in DMEM containing 5.5 or 30 mM glucose for 72 h, and then cardiomyocyte injury was determined by the number of PI positive cells (A: p < 0.01, n = 5), the levels of cCasp3 (B: p < 0.01, n = 4), MitoSOX (C: p < 0.01, n = 3) and ΔΨm (D: JC-1, p < 0.05, n = 3). Data were expressed as mean ± SEM and analyzed by two-way ANOVA. Scale bars represent (A) 200 μm, (C) 200 μm, (D) 100 μm, respectively.
FIGURE 6
FIGURE 6
Parkin overexpression increased basal mitophagy and relieved the inhibition of mitophagy flux by high glucose. NRVCs were infected with Admt-Rosella and AdParkin or Adβgal and cultured in DMEM containing 5.5 or 30 mM glucose for 72 h. Mitochondrial morphology was examined with confocal microscopy and the merged confocal images (A) were analyzed using ImageJ. The relative mitochondrial sizes (B) and the number of mitophagy foci (red puncta or dots, C) in each cell were obtained by particle analysis measurements. At least five images (each containing between 5 and 8 cells) were captured per treatment. Scale bar = 20 μm. Mitophagy flux was measured with and without PepA and E64D, and denoted by the red number and the red vertical line with arrows at both ends in the bar graphs. Data were expressed as mean ± SEM and analyzed by two-way ANOVA (n = 5 for each group with p values indicated in the graphs).
FIGURE 7
FIGURE 7
Parkin knockdown inhibited mitophagy flux in cardiomyocytes. NRVCs were infected with Admt-Rosella, transfected with scrambled control or Parkin-targeted synthetic siRNA, and cultured with DMEM containing 5.5 or 30 mM glucose for 72 h. Mitochondrial morphology was examined with confocal microscopy and the merged confocal images (A) were analyzed using ImageJ. The relative mitochondrial sizes (B) and the number of mitophagy foci (C) in each cell were obtained by particle analysis measurements. At least five images (each containing between 5 and 8 cells) were captured per treatment. Scale bar = 20 μm. Experiments were repeated with addition of lysosomal inhibitors (PepA and E64D) for evaluating mitophagy flux which was denoted by the red number and the red vertical line with arrows at both ends in the bar graphs. Data were expressed as mean ± SEM and analyzed by two-way ANOVA (n = 5 for each group with p values indicated in the graphs).
FIGURE 8
FIGURE 8
High glucose inhibited mitophagy flux. NRVCs were cultured in DMEM containing 5.5 or 30 mM glucose for 72 h. The LC3-II levels were determined by Western blot analysis in total cell lysates (A), cytoplasmic fractions (B) or mitochondrial fractions (C) with or without adding PepA and E64d. Mitophagy flux was denoted by the red number and the red vertical line with arrows at both ends in the bar graphs. Data were expressed as mean ± SEM and analyzed by two-way ANOVA (n = 5 for each group with p values indicated in the graphs).
FIGURE 9
FIGURE 9
Parkin overexpression diminished high glucose-induced cardiomyocyte injury. NRVCs were infected with AdParkin or Adβgal and cultured in DMEM containing 5.5 or 30 mM glucose for 72 h, and cardiomyocyte injury was determined by the number of PI positive cells (A: p < 0.01, n = 5), the levels of cCasp3 (B: p < 0.01, n = 4), MitoSOX (C: p < 0.01, n = 3) and ΔΨm (D: JC-1, p < 0.05, n = 3). Data were expressed as mean ± SEM and analyzed by two-way ANOVA. Scale bars represent (A) 200 μm, (C) 200 μm, (D) 100 μm, respectively.
FIGURE 10
FIGURE 10
Parkin knockdown exacerbated high glucose-induced cardiomyocyte death. NRVCs were transfected with scrambled control or Parkin-targeted synthetic siRNA, cultured with DMEM containing 5.5 or 30 mM glucose for 72 h, and cardiomyocyte injury was determined by the number of PI positive cells (A: p < 0.01, n = 5), the levels of cCasp3 (B: p < 0.01, n = 3), MitoSOX (C: p < 0.01, n = 3) and ΔΨm (D: JC-1, p < 0.05, n = 3). Data were expressed as mean ± SEM and analyzed by two-way ANOVA. Scale bars represent (A) 200 μm, (C) 200 μm, (D) 100 μm, respectively.
FIGURE 11
FIGURE 11
High glucose induced mitochondrial fragmentation but reduced mitophagy flux in adult mouse cardiomyocytes (AMCs). The AMCs were isolated from adult transgenic mouse hearts that express mt-Rosella reporter and cultured with 5.5 or 30 mM glucose for 72 h. (A) Red fluorescence images were obtained by confocal microscopy and analyzed with ImageJ. After image optimization, four images were analyzed and the average mitochondrial particle sizes, numbers and areas were calculated. (B) The representative images showed mitophagy foci (red puncta indicated by the arrow heads) in AMCs. The number of mitophagy foci was quantified manually. At least four images were captured per treatment. Experiments were repeated with addition of lysosomal inhibitors (PepA and E64D). Mitophagy flux was calculated by subtracting the mean of red puncta without inhibitors from the corresponding mean value of red puncta with inhibitors, which was denoted by the red number and the red vertical line with arrows at both ends in the bar graphs. Data are expressed as mean ± SEM and were analyzed by using unpaired student t-test (p < 0.01 vs. 5.5 mM glucose, n = 5). Scale bar = 10 μm.
FIGURE 12
FIGURE 12
A graphic presentation of the roles of mitochondrial fission and mitophagy in high glucose cardiotoxicity. Mitochondrial quality is controlled by a number of coordinated mechanisms including mitochondrial biogenesis, fission and mitophagy. Injured mitochondrial segments are separated by mitochondrial fission and eliminated by mitophagy. High glucose (hyperglycemic stress) induced mitochondrial fragmentation and inhibited mitophagy, which was associated with increased cardiomyocyte death. Overexpression of DRP1 and Parkin or treatment with the mitochondrial uncoupler CCCP each increased mitophagy and protected from high glucose-induced cardiomyocytes death. Conversely, the fission inhibitor Mdivi-1 and Parkin knockdown exacerbated high glucose-induced cardiomyocyte death. These results suggest that promoting the positive interaction between mitochondrial fission and mitophagy while simultaneously maintain their levels within the physiological range would be expected to improve mitochondrial health, alleviating hyperglycemic cardiotoxicity.

References

    1. Ackers-Johnson M., Li P. Y., Holmes A. P., O’Brien S. M., Pavlovic D., Foo R. S. (2016). A simplified, langendorff-free method for concomitant isolation of viable cardiac myocytes and nonmyocytes from the adult mouse heart. Circ. Res. 119 909–920. 10.1161/circresaha.116.309202 - DOI - PMC - PubMed
    1. Ashrafian H., Docherty L., Leo V., Towlson C., Neilan M., Steeples V., et al. (2010). A mutation in the mitochondrial fission gene Dnm1l leads to cardiomyopathy. PLoS Genet. 6:e1001000. 10.1371/journal.pgen.1001000 - DOI - PMC - PubMed
    1. Boudina S., Abel E. D. (2006). Mitochondrial uncoupling: a key contributor to reduced cardiac efficiency in diabetes. Physiology 21 250–258. 10.1152/physiol.00008.2006 - DOI - PubMed
    1. Boudina S., Abel E. D. (2007). Diabetic cardiomyopathy revisited. Circulation 115 3213–3223. 10.1161/circulationaha.106.679597 - DOI - PubMed
    1. Brand C. S., Tan V. P., Brown J. H., Miyamoto S. (2018). RhoA regulates Drp1 mediated mitochondrial fission through ROCK to protect cardiomyocytes. Cell. Signal. 50 48–57. 10.1016/j.cellsig.2018.06.012 - DOI - PMC - PubMed