

Effects of In Vivo Gluten Challenge on PBMC Gene Expression Profiles in Diet Treated Celiac Disease
- PMID: 33362776
- PMCID: PMC7759501
- DOI: 10.3389/fimmu.2020.594243
Effects of In Vivo Gluten Challenge on PBMC Gene Expression Profiles in Diet Treated Celiac Disease
Abstract
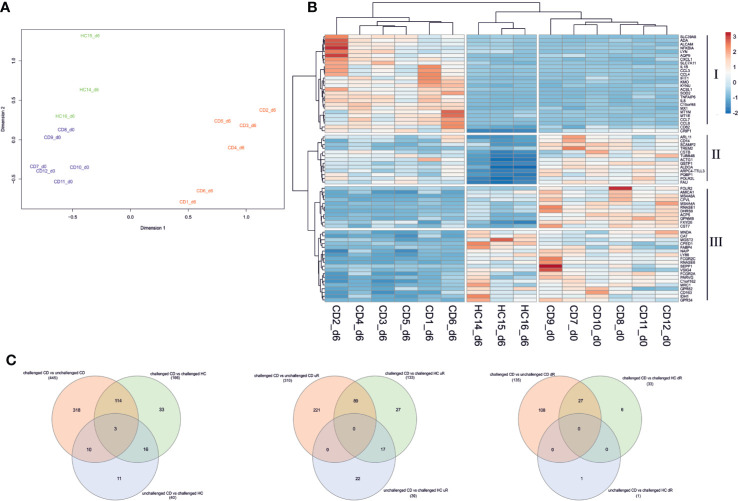
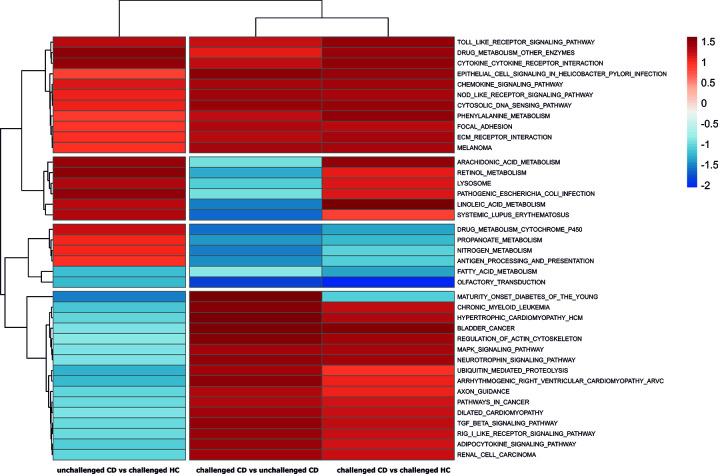
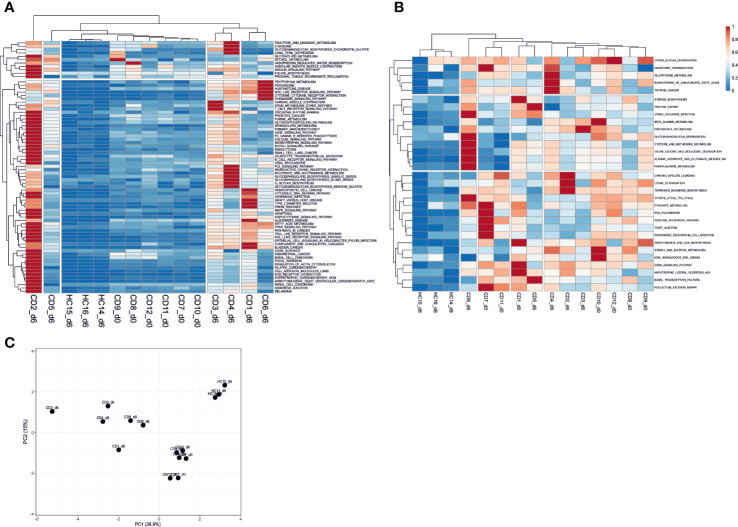
The pathological mechanisms that lead to the onset and reactivation of celiac disease (CD) remain largely unknown. While gluten free diet (GFD) improves the intestinal damage and associated clinical symptoms in majority of cases, it falls short of providing full recovery. Additionally, late or misdiagnosis is also common as CD presents with a wide range of symptoms. Clear understanding of CD pathogenesis is thus critical to address both diagnostic and treatment concerns. We aimed to study the molecular impact of short gluten exposure in GFD treated CD patients, as well as identify biological pathways that remain altered constitutively in CD regardless of treatment. Using RNAseq profiling of PBMC samples collected from treated CD patients and gluten challenged patient and healthy controls, we explored the peripheral transcriptome in CD patients following a short gluten exposure. Short gluten exposure of just three days was enough to alter the genome-wide PBMC transcriptome of patients. Pathway analysis revealed gluten-induced upregulation of mainly immune response related pathways, both innate and adaptive, in CD patients. We evaluated the perturbation of biological pathways in sample-specific manner. Compared to gluten exposed healthy controls, pathways related to tight junction, olfactory transduction, metabolism of unsaturated fatty acids (such as arachidonic acid), metabolism of amino acids (such as cysteine and glutamate), and microbial infection were constitutively altered in CD patients regardless of treatment, while GFD treatment appears to mostly normalize immune response pathways to "healthy" state. Upstream regulator prediction analysis using differentially expressed genes identified constitutively activated regulators relatively proximal to previously reported CD associated loci, particularly SMARCA4 on 19p13.2 and CSF2 on 5q31. We also found constitutively upregulated genes in CD that are in CD associated genetic loci such as MEF2BNB-MEF2B (BORCS8-MEF2B) on 19p13.11 and CSTB on 21q22.3. RNAseq revealed strong effects of short oral gluten challenge on whole PBMC fraction and constitutively altered pathways in CD PBMC suggesting important factors other than gluten in CD pathogenesis.
Keywords: celiac disease; celiac disease RNA sequencing; celiac disease gene expression analysis; celiac disease transcriptomics; pathway analysis, gluten challenge.
Copyright © 2020 Yohannes, de Kauwe, Kaukinen, Kurppa, Mäki, Anderson, Linnarsson, Greco and Saavalainen.
Conflict of interest statement
The authors declare that the research was conducted in the absence of any commercial or financial relationships that could be construed as a potential conflict of interest.
Figures
Similar articles
-
Identification of peculiar gene expression profile in peripheral blood mononuclear cells (PBMC) of celiac patients on gluten free diet.PLoS One. 2018 May 24;13(5):e0197915. doi: 10.1371/journal.pone.0197915. eCollection 2018. PLoS One. 2018. PMID: 29795662 Free PMC article.
-
Genome-Wide Transcriptomic Analysis of Intestinal Mucosa in Celiac Disease Patients on a Gluten-Free Diet and Postgluten Challenge.Cell Mol Gastroenterol Hepatol. 2021;11(1):13-32. doi: 10.1016/j.jcmgh.2020.07.010. Epub 2020 Jul 31. Cell Mol Gastroenterol Hepatol. 2021. PMID: 32745639 Free PMC article. Clinical Trial.
-
Oral Consumption of Bread from an RNAi Wheat Line with Strongly Silenced Gliadins Elicits No Immunogenic Response in a Pilot Study with Celiac Disease Patients.Nutrients. 2021 Dec 18;13(12):4548. doi: 10.3390/nu13124548. Nutrients. 2021. PMID: 34960101 Free PMC article.
-
Gut microbes and adverse food reactions: Focus on gluten related disorders.Gut Microbes. 2014;5(5):594-605. doi: 10.4161/19490976.2014.969635. Gut Microbes. 2014. PMID: 25483329 Free PMC article. Review.
-
Physiopathology and Management of Gluten-Induced Celiac Disease.J Food Sci. 2017 Feb;82(2):270-277. doi: 10.1111/1750-3841.13612. Epub 2017 Jan 31. J Food Sci. 2017. PMID: 28140462 Review.
Cited by
-
Expression of Selected Genes and Circulating microRNAs in Patients with Celiac Disease.Medicina (Kaunas). 2022 Jan 25;58(2):180. doi: 10.3390/medicina58020180. Medicina (Kaunas). 2022. PMID: 35208504 Free PMC article.
-
Gastrointestinal and Extraintestinal Symptoms Among Subjects With Celiac Disease Undergoing a Dose-Specified Gluten Challenge: A Systematic Review and Meta-Analysis.Am J Gastroenterol. 2025 Apr 29:10.14309/ajg.0000000000003506. doi: 10.14309/ajg.0000000000003506. Online ahead of print. Am J Gastroenterol. 2025. PMID: 40298233
-
Exploratory Analysis of Selected Components of the mTOR Pathway Reveals Potentially Crucial Associations with Childhood Malnutrition.Nutrients. 2022 Apr 12;14(8):1612. doi: 10.3390/nu14081612. Nutrients. 2022. PMID: 35458174 Free PMC article.
References
-
- Koehler P, Wieser H, Konitzer K. “Chapter 1 - Celiac Disease—A Complex Disorder,” in Celiac Disease and Gluten. Eds. Koehler P., Wieser H., Konitzer K. (Boston: Academic Press; ) (2014), 1–96. 10.1016/B978-0-12-420220-7.00001-8 - DOI
-
- Hadjivassiliou M, Croall ID, Zis P, Sarrigiannis PG, Sanders DS, Aeschlimann P, et al. Neurologic Deficits in Patients With Newly Diagnosed Celiac Disease Are Frequent and Linked With Autobodies to Transglutaminase 6. Clin Gastroenterol Hepatol (2019) 17:2678–86.e2. 10.1016/j.cgh.2019.03.014 - DOI - PubMed
-
- Fuchs V, Kurppa K, Huhtala H, Mäki M, Kekkonen L, Kaukinen K. Delayed celiac disease diagnosis predisposes to reduced quality of life and incremental use of health care services and medicines: A prospective nationwide study. U Eur Gastroenterol J (2018) 6:567–75. 10.1177/2050640617751253 - DOI - PMC - PubMed
Publication types
MeSH terms
Substances
LinkOut - more resources
Full Text Sources
Medical
Research Materials
Miscellaneous