Plant Salinity Tolerance Conferred by Arbuscular Mycorrhizal Fungi and Associated Mechanisms: A Meta-Analysis
- PMID: 33362816
- PMCID: PMC7755987
- DOI: 10.3389/fpls.2020.588550
Plant Salinity Tolerance Conferred by Arbuscular Mycorrhizal Fungi and Associated Mechanisms: A Meta-Analysis
Abstract
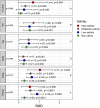
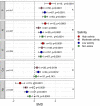
Soil salinity often hinders plant productivity in both natural and agricultural settings. Arbuscular mycorrhizal fungal (AMF) symbionts can mediate plant stress responses by enhancing salinity tolerance, but less attention has been devoted to measuring these effects across plant-AMF studies. We performed a meta-analysis of published studies to determine how AMF symbionts influence plant responses under non-stressed vs. salt-stressed conditions. Compared to non-AMF plants, AMF plants had significantly higher shoot and root biomass (p < 0.0001) both under non-stressed conditions and in the presence of varying levels of NaCl salinity in soil, and the differences became more prominent as the salinity stress increased. Categorical analyses revealed that the accumulation of plant shoot and root biomass was influenced by various factors, such as the host life cycle and lifestyle, the fungal group, and the duration of the AMF and salinity treatments. More specifically, the effect of Funneliformis on plant shoot biomass was more prominent as the salinity level increased. Additionally, under stress, AMF increased shoot biomass more on plants that are dicots, plants that have nodulation capacity and plants that use the C3 plant photosynthetic pathway. When plants experienced short-term stress (<2 weeks), the effect of AMF was not apparent, but under longer-term stress (>4 weeks), AMF had a distinct effect on the plant response. For the first time, we observed significant phylogenetic signals in plants and mycorrhizal species in terms of their shoot biomass response to moderate levels of salinity stress, i.e., closely related plants had more similar responses, and closely related mycorrhizal species had similar effects than distantly related species. In contrast, the root biomass accumulation trait was related to fungal phylogeny only under non-stressed conditions and not under stressed conditions. Additionally, the influence of AMF on plant biomass was found to be unrelated to plant phylogeny. In line with the greater biomass accumulation in AMF plants, AMF improved the water status, photosynthetic efficiency and uptake of Ca and K in plants irrespective of salinity stress. The uptake of N and P was higher in AMF plants, and as the salinity increased, the trend showed a decline but had a clear upturn as the salinity stress increased to a high level. The activities of malondialdehyde (MDA), peroxidase (POD), and superoxide dismutase (SOD) as well as the proline content changed due to AMF treatment under salinity stress. The accumulation of proline and catalase (CAT) was observed only when plants experienced moderate salinity stress, but peroxidase (POD) and superoxide dismutase (SOD) were significantly increased in AMF plants irrespective of salinity stress. Taken together, arbuscular mycorrhizal fungi influenced plant growth and physiology, and their effects were more notable when their host plants experienced salinity stress and were influenced by plant and fungal traits.
Keywords: AMF; antioxidant; effect size; photosynthesis; phylogenetic signal; plant biomass; plant physiology; standardized mean difference.
Copyright © 2020 Dastogeer, Zahan, Tahjib-Ul-Arif, Akter and Okazaki.
Conflict of interest statement
The authors declare that the research was conducted in the absence of any commercial or financial relationships that could be construed as a potential conflict of interest.
Figures


Similar articles
-
A meta-analysis of arbuscular mycorrhizal effects on plants grown under salt stress.Mycorrhiza. 2014 Nov;24(8):611-25. doi: 10.1007/s00572-014-0582-7. Epub 2014 Apr 27. Mycorrhiza. 2014. PMID: 24770494
-
Mycorrhizal Symbiotic Efficiency on C3 and C4 Plants under Salinity Stress - A Meta-Analysis.Front Microbiol. 2016 Aug 11;7:1246. doi: 10.3389/fmicb.2016.01246. eCollection 2016. Front Microbiol. 2016. PMID: 27563299 Free PMC article.
-
Sex-Specific Differences in the Physiological and Biochemical Performance of Arbuscular Mycorrhizal Fungi-Inoculated Mulberry Clones Under Salinity Stress.Front Plant Sci. 2021 Mar 18;12:614162. doi: 10.3389/fpls.2021.614162. eCollection 2021. Front Plant Sci. 2021. PMID: 33815436 Free PMC article.
-
Role of Arbuscular Mycorrhizal Fungi in Regulating Growth, Enhancing Productivity, and Potentially Influencing Ecosystems under Abiotic and Biotic Stresses.Plants (Basel). 2023 Aug 29;12(17):3102. doi: 10.3390/plants12173102. Plants (Basel). 2023. PMID: 37687353 Free PMC article. Review.
-
Experimental duration determines the effect of arbuscular mycorrhizal fungi on plant biomass in pot experiments: A meta-analysis.Front Plant Sci. 2022 Nov 3;13:1024874. doi: 10.3389/fpls.2022.1024874. eCollection 2022. Front Plant Sci. 2022. PMID: 36407631 Free PMC article.
Cited by
-
Exogenous SA Applications Alleviate Salinity Stress via Physiological and Biochemical changes in St John's Wort Plants.Plants (Basel). 2023 Jan 9;12(2):310. doi: 10.3390/plants12020310. Plants (Basel). 2023. PMID: 36679023 Free PMC article.
-
Seed or soil: Tracing back the plant mycobiota primary sources.Environ Microbiol Rep. 2024 Jun;16(3):e13301. doi: 10.1111/1758-2229.13301. Environ Microbiol Rep. 2024. PMID: 38924368 Free PMC article.
-
Effects of the synergistic treatments of arbuscular mycorrhizal fungi and trehalose on adaptability to salt stress in tomato seedlings.Microbiol Spectr. 2024 Mar 5;12(3):e0340423. doi: 10.1128/spectrum.03404-23. Epub 2024 Jan 23. Microbiol Spectr. 2024. PMID: 38259091 Free PMC article.
-
Resistance of Mycorrhizal Cinnamomum camphora Seedlings to Salt Spray Depends on K+ and P Uptake.J Fungi (Basel). 2023 Sep 26;9(10):964. doi: 10.3390/jof9100964. J Fungi (Basel). 2023. PMID: 37888220 Free PMC article.
-
Effects of Mycorrhizal Colonization on Transcriptional Expression of the Responsive Factor JERF3 and Stress-Responsive Genes in Banana Plantlets in Response to Combined Biotic and Abiotic Stresses.Front Plant Sci. 2021 Oct 28;12:742628. doi: 10.3389/fpls.2021.742628. eCollection 2021. Front Plant Sci. 2021. PMID: 34777424 Free PMC article.
References
-
- Abdel-Fattah G. M., Asrar A.-W. A. (2012). Arbuscular mycorrhizal fungal application to improve growth and tolerance of wheat (Triticum aestivum L.) plants grown in saline soil. Acta Physiol. Plant. 34, 267–277. 10.1007/s11738-011-0825-6 - DOI
-
- Abouheif E. (1999). A method for testing the assumption of phylogenetic independence in comparative data. Evol. Ecol. Res. 1, 895–909.
-
- Alatalo R. V., Mappes J., Elgar M. A. (1997). Heritabilities and paradigm shifts. Nature 385, 402–403. 10.1038/385402a0 - DOI
-
- Al-Karaki G. N., Hammad R., Rusan M. (2001). Response of two tomato cultivars differing in salt tolerance to inoculation with mycorrhizal fungi under salt stress. Mycorrhiza 11, 43–47. 10.1007/s005720100098 - DOI
Publication types
LinkOut - more resources
Full Text Sources
Miscellaneous

