. 2020 Dec 9:11:594184.
doi: 10.3389/fpls.2020.594184. eCollection 2020.

Abscisic Acid Deficiency Alters Epicuticular Wax Metabolism and Morphology That Leads to Increased Cuticle Permeability During Sweet Orange (Citrus sinensis) Fruit Ripening

Affiliations

Abscisic Acid Deficiency Alters Epicuticular Wax Metabolism and Morphology That Leads to Increased Cuticle Permeability During Sweet Orange (Citrus sinensis) Fruit Ripening

Paco Romero et al. Front Plant Sci. .

Abstract

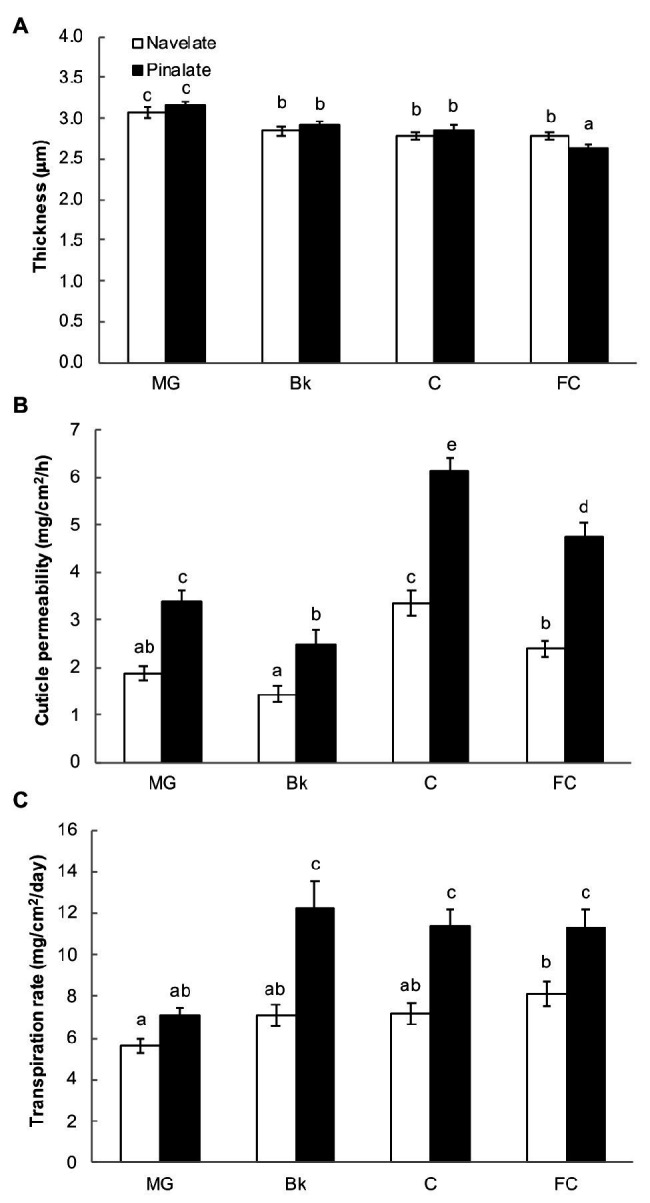
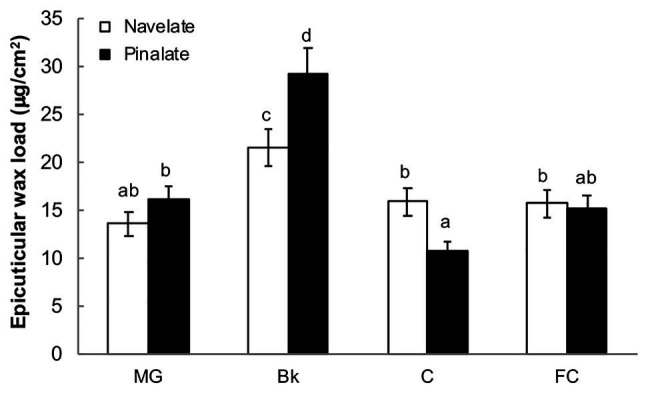
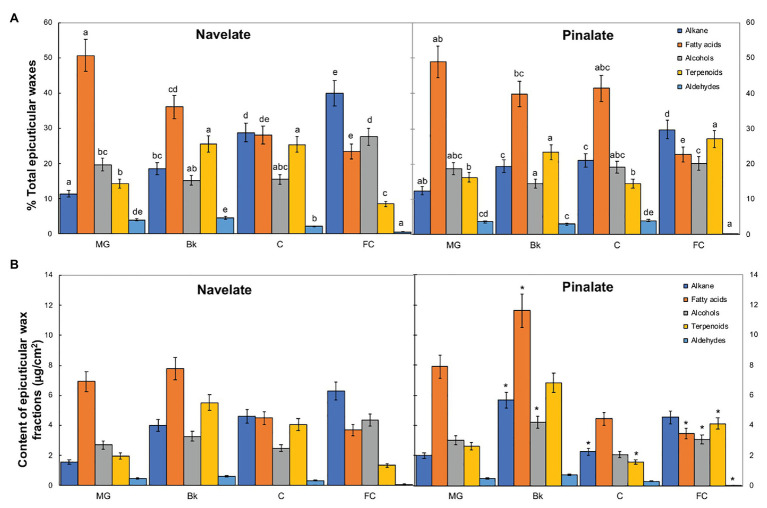
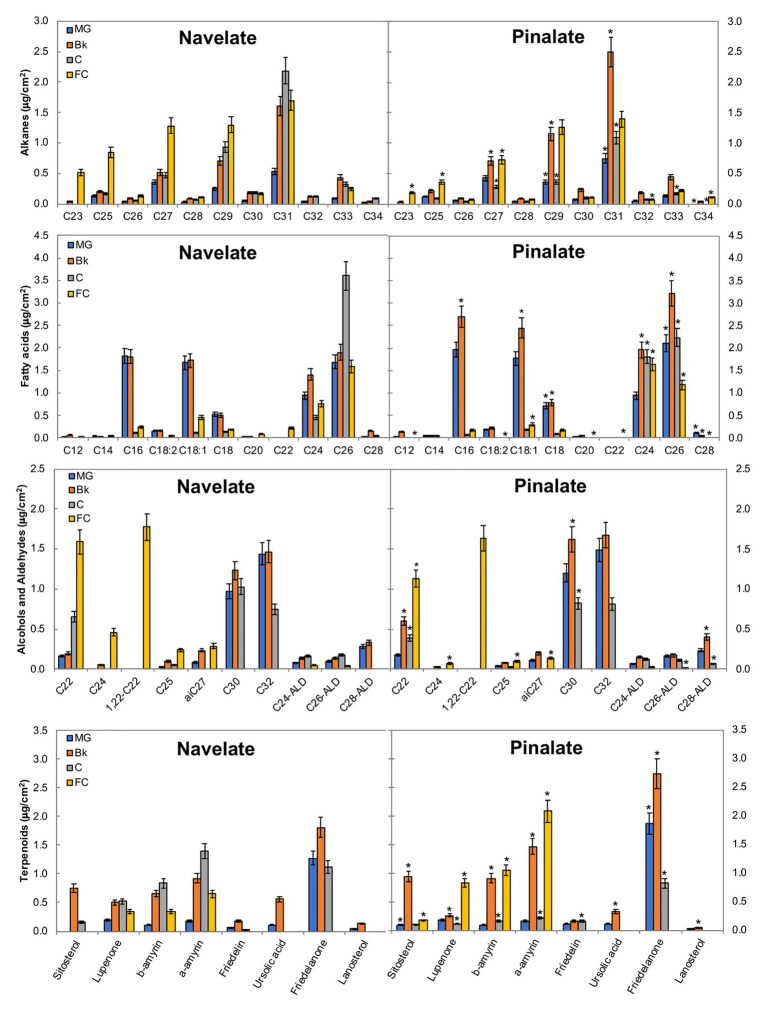
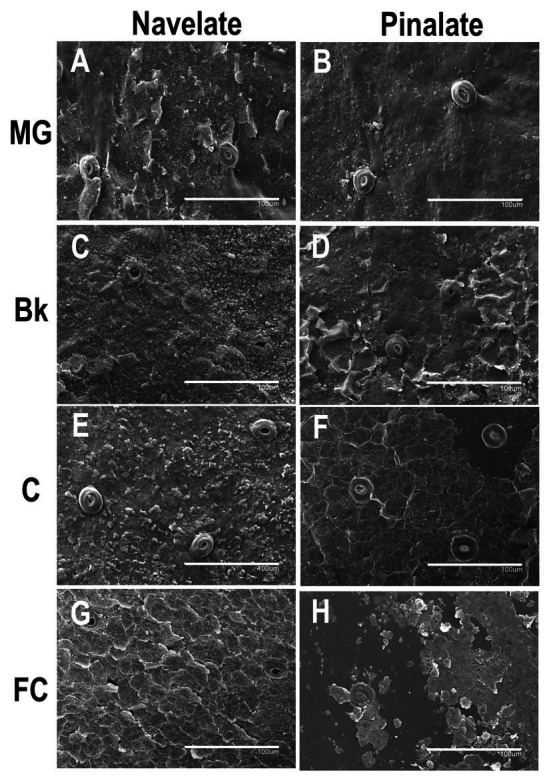
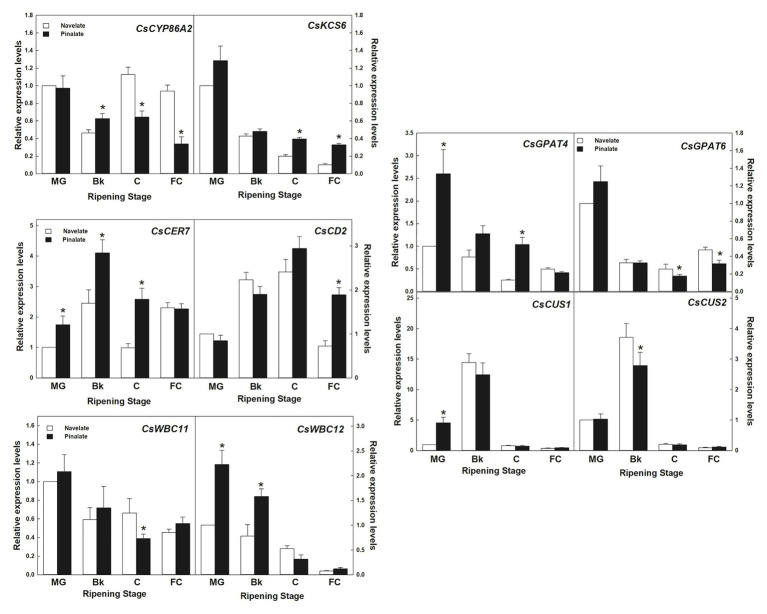
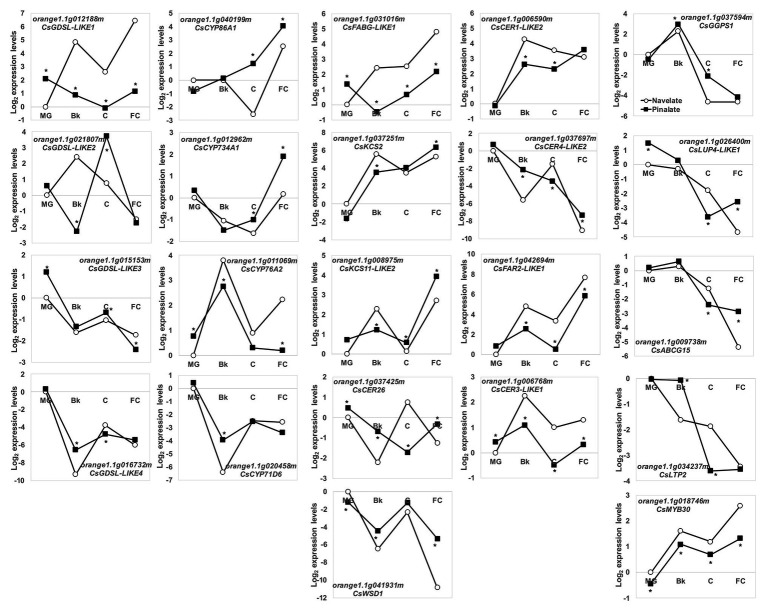
Citrus fruit ripening is coupled with the synthesis and deposition of epicuticular waxes, which reduces water loss during fruit postharvest storage. Although abscisic acid (ABA) is a major regulator of citrus fruit ripening, whether ABA mediates epicuticular wax formation during this process remains poorly understood. We investigated the implication of ABA in cuticle properties and epicuticular wax metabolism, composition, and morphology by comparing the Navelate orange [Citrus sinensis (L.) Osbeck] and its ABA biosynthesis-impaired mutant Pinalate in four ripening stages. ABA deficiency had minor effects on cuticle thickness and epicuticular wax load, but correlated with cuticle permeability. ABA content aligned with mostly fatty acids accumulation in both cultivars, and also with specific alkane, terpenoid, and aldehyde constituents in the parental fruit. In turn, cuticle permeability correlated with the fatty acid profile during fruit ripening in the Navelate and Pinalate, and with primary alcohols, terpenoids, and aldehydes, but only in the mutant fruit. Low ABA levels increased the susceptibility of waxes to crack and were lost from the epicuticular layer. The RNA-seq analysis highlighted the differential regulation of a list of 87 cuticle-related genes between genotypes and ripening stages. Changes in the gene expression of the selected genes in both cultivars were consistent with the content of the aliphatics and terpenoid fractions during ripening. The results suggest a role for ABA in the regulation of fatty acid content and primary alcohol composition, and point out the importance of alkane and triterpenoid for controlling water permeance through fruit cuticles.

Keywords: abscisic acid; cuticle; fruit quality; permeability; ripening; transcriptome; transpiration rate; wax morphology.


Conflict of interest statement

The authors declare that the research was conducted in the absence of any commercial or financial relationships that could be construed as a potential conflict of interest.

Figures

Figure 1
Figure 1
Cuticle properties and fruit weight loss. For cuticle thickness (A), peel sections were stained with Oil Red O, and bars represent the means ± SD of 50–60 measurements for each condition. Cuticle permeability (B) was calculated as weight loss per surface area per hour using gravimetric chambers stored for 7 days at 20°C and with 0% RH. Bars are the means ± SD of 10 replicates. (C) Transpiration rates of the Navelate and Pinalate fruit, calculated as weight loss per surface area per day from the mature green (MG), breaker (Bk), colored (C), and full-colored (FC) fruit stored for 7 days at 20°C and with 60–65% RH. Bars are the means ± SD of three replicates of 10 fruits each. Different letters indicate the statistical (p < 0.05) differences between developmental stages and genotypes according to a multifactor ANOVA analysis followed by a Tukey test (p < 0.05) for each studied parameter.
Figure 2
Figure 2
Evolution of epicuticular wax deposition during ripening. The total epicuticular wax load in the Navelate and Pinalate mature green (MG), breaker (Bk), colored (C), and full-colored (FC) fruit. Bars are the means ± SD of four replicates per condition. Different letters indicate the statistical (p < 0.05) differences between developmental stages and genotypes according to a multifactor ANOVA analysis followed by a Tukey test (p < 0.05).
Figure 3
Figure 3
Evolution of epicuticular wax composition during ripening. Percentage (A) and content (B) of the epicuticular wax fractions in the Navelate and Pinalate mature green (MG), breaker (Bk), colored (C), and full-colored (FC) fruits. Bars are the means ± SD of four replicates per condition. (A) Different letters indicate the statistical (p < 0.05) differences between developmental stages and genotypes according to a multifactor ANOVA analysis followed by a Tukey test (p < 0.05) for each wax fraction. (B) The asterisks on the Pinalate bars indicate the statistical (p < 0.05) differences between cultivars according to a t test for each developmental stage.
Figure 4
Figure 4
Epicuticular wax constituents during fruit ripening. The total amount of the specific components of the epicuticular wax fractions in the Navelate and Pinalate mature green (MG), breaker (Bk), colored (C), and full-colored (FC) fruit cuticles. Bars are the means ± SD of four replicates per condition. The asterisks on the Pinalate bars indicate the statistical (p < 0.05) differences between cultivars according to a t test for each developmental stage. Asterisks are also used for those compounds that were detected in only one genotype.
Figure 5
Figure 5
Epicuticular wax morphology during fruit ripening. Scan electron micrographs of Navelate (A) and Pinalate (B) mature green, Navelate (C) and Pinalate (D) breaker, Navelate (E) and Pinalate (F) colored, and Navelate (G) and Pinalate (H) full-colored fruit ripening stages. The same scale was used in all the micrographs. Scale bars: 100 μm.
Figure 6
Figure 6
Gene expression analysis of the cuticle-related genes selected from the RNA-Seq transcriptome comparative analysis. Relative transcript abundance for the selected wax and cutin biosynthetic genes, and the cuticle-related transcription factors and transporters belonging to the “lipid metabolism” category differentially regulated in the Navelate (black) and Pinalate (white) flavedo in four ripening stages. For each gene, the transcript levels for all conditions were expressed in relation to the MG Navelate fruit. Data are the mean values of three biological replicates ± SD. The asterisks on the Pinalate bars indicate the statistical differences between genotypes according to a t-test (p < 0.05) for each ripening stage. These values were also used for validating the transcriptomic data, with an R2 value of 0.934 in a linear regression analysis.
Figure 7
Figure 7
Transcriptional regulation of cuticle metabolism during fruit ripening. Relative gene expression levels of the DEG related to the wax and cutin biosynthesis, and the cuticle-related transcription factors and transporters in the Navelate (white circles) and Pinalate (black squares) mature green (MG), breaker (Bk), colored (C), and full-colored (FC) fruit according to the RNA-Seq data analysis. Values are the means of the log2 fold change expression levels of three biological replicates per condition. The expression levels for all conditions were expressed in relation to the MG Navelate fruit. Asterisks indicate the statistical differences according to the edgeR statistical test after modeling the normalized RNA-Seq data to a negative binomial distribution.

Similar articles

Cited by

References

    1. Aarts M. G. M., Keijzer C. J., Stiekema W. J., Pereira A. (1995). Molecular characterization of the CER1 gene of arabidopsis involved in epicuticular wax biosynthesis and pollen fertility. Plant Cell 7, 2115–2127. 10.1105/tpc.7.12.2115, PMID: - DOI - PMC - PubMed
    1. Albrigo L. G. (1972). Distribution of stomata and epicuticular wax oranges as related to stem end rind breakdown and water loss. J. Am. Soc. Hortic. Sci. 97, 220–223.
    1. Alexa A., Rahnenführer J., Lengauer T. (2006). Improved scoring of functional groups from gene expression data by decorrelating GO graph structure. Bioinformatics 22, 1600–1607. 10.1093/bioinformatics/btl140, PMID: - DOI - PubMed
    1. Alférez F., Sala J. M., Sanchez-Ballesta M. T., Mulas M., Lafuente M. T., Zacarias L. (2005). A comparative study of the postharvest performance of an ABA-deficient mutant of oranges: I. physiological and quality aspects. Postharvest Biol. Technol. 37, 222–231. 10.1016/j.postharvbio.2005.05.010 - DOI
    1. Aragón W., Reina-Pinto J. J., Serrano M. (2017). The intimate talk between plants and microorganisms at the leaf surface. J. Exp. Bot. 68, 5339–5350. 10.1093/jxb/erx327, PMID: - DOI - PubMed

LinkOut - more resources