. 2020 Dec 9:7:589435.
doi: 10.3389/fmolb.2020.589435. eCollection 2020.

Proteome of the Triatomine Digestive Tract: From Catalytic to Immune Pathways; Focusing on Annexin Expression

Affiliations

Proteome of the Triatomine Digestive Tract: From Catalytic to Immune Pathways; Focusing on Annexin Expression

Marcia Gumiel et al. Front Mol Biosci. .

Abstract

Rhodnius prolixus, Panstrongylus megistus, Triatoma infestans, and Dipetalogaster maxima are all triatomines and potential vectors of the protozoan Trypanosoma cruzi responsible for human Chagas' disease. Considering that the T. cruzi's cycle occurs inside the triatomine digestive tract (TDT), the analysis of the TDT protein profile is an essential step to understand TDT physiology during T. cruzi infection. To characterize the protein profile of TDT of D. maxima, P. megistus, R. prolixus, and T. infestans, a shotgun liquid chromatography-tandem mass spectrometry (LC-MS/MS) approach was applied in this report. Most proteins were found to be closely related to metabolic pathways such as gluconeogenesis/glycolysis, citrate cycle, fatty acid metabolism, oxidative phosphorylation, but also to the immune system. We annotated this new proteome contribution gathering it with those previously published in accordance with Gene Ontology and KEGG. Enzymes were classified in terms of class, acceptor, and function, while the proteins from the immune system were annotated by reference to the pathways of humoral response, cell cycle regulation, Toll, IMD, JNK, Jak-STAT, and MAPK, as available from the Insect Innate Immunity Database (IIID). These pathways were further subclassified in recognition, signaling, response, coagulation, melanization and none. Finally, phylogenetic affinities and gene expression of annexins were investigated for understanding their role in the protection and homeostasis of intestinal epithelial cells against the inflammation.

Keywords: annexin; chagas disease; digestive tract; enzymes; immunity; mass spectrometry; triatomine.


Conflict of interest statement

The authors declare that the research was conducted in the absence of any commercial or financial relationships that could be construed as a potential conflict of interest.

Figures

FIGURE 1
FIGURE 1
Venn diagram of proteins found in the digestive tract of D. maxima, P. megistus, R. prolixus, and T. infestans.
FIGURE 2
FIGURE 2
Venn diagram (Interactivenn) of complete EC annotations from our samples and those of Ribeiro et al. (2014), Vieira et al. (2015), and Ouali et al. (2020). The total number of enzyme functions (ECs) is indicated beside each ellipse.
FIGURE 3
FIGURE 3
Metabolic pathways (KEGG) with the highest proportion of mapped ECs after excluding alternative routes. The percentages represent the proportion of ECs found by similarity search.
FIGURE 4
FIGURE 4
Venn diagram of the immune-related genes found by mapping the sequences of our triatomine samples as well as those of Ribeiro et al. (2014), Vieira et al. (2015), and Ouali et al. (2020) by reference to IIID, KEGG, and NCBI (see Table 3).
FIGURE 5
FIGURE 5
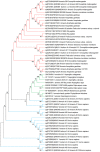
Phylogenetic tree of annexin sequences from fungi, insects, and humans. Non-rooted NJ phylogenetic tree was constructed with MEGA-X4. The numbers adjacent to the branches represent bootstrap values based on 10,000 replicates.
FIGURE 6
FIGURE 6
Spatial and temporal relative gene expression of RPRC011897 (RpAnnex1) in fifth instar nymphs of R. prolixus. Blood-fed insects were dissected, and the digestive tract was separated in anterior midgut (AM) and posterior midgut (PM) at 1 and 7 days after feeding (DAF). (A) Expression of RpAnnex1 in AM and PM at 1 DAF. (B) Expression of RpAnnex1 in AM and PM at 7 DAF. (C) Expression of RpAnnex1 in AM at 1 and 7 DAF. (D) Expression of RpAnnex1 in PM at 1 and 7 DAF. Calibrators genes used in the relative quantification of gene expression were α-tubulin and GAPDH. Bars represent the mean ± the standard error of the mean (SEM) of two independent experiments with three pools of R. prolixus (n = 3). Means were compared applying Student’s t-test; **p < 0.01, *p < 0.05, and ns stands for non-significant.
FIGURE 7
FIGURE 7
Spatial and temporal relative gene expression of RPRC003519 (RpAnnex2) in fifth instar nymphs of Rhodnius prolixus. Blood-fed insects were dissected, and tissues were separated in anterior midgut (AM) and posterior midgut (PM) at 1 and 7 days after feeding. (A) Expression of RpAnnex2 in AM and PM at 1 day after blood feeding, (B) Expression of RpAnnex2 in AM and PM at 7 day after blood feeding, (C) Expression of RpAnnex2 in AM at 1 and 7 days after blood feeding, (D) Expression of RpAnnex2 in PM at 1 and 7 days after blood feeding. Calibrators genes used in the relative quantification of gene expression were α-tubulin and GAPDH. Bars represent the mean ± the standard error of the mean (SEM) of two independent experiments with three pools of R. prolixus (n = 3). Means were compared applying Student’s t-test; *p < 0.05, and ns stands for non-significant.
FIGURE 8
FIGURE 8
Spatial and temporal relative gene expression of RPRC013832 (RpAnnex3) in fifth instar nymphs of Rhodnius prolixus. Blood-fed insects were dissected and tissues were separated in anterior midgut (AM) and posterior midgut (PM) at 1 and 7 days after feeding. (A) Expression of RpAnnex3 in AM and PM at 1 day after blood feeding, (B) Expression of RpAnnex3 in AM and PM at 7 day after blood feeding, (C) Expression of RpAnnex3 in AM at 1 and 7 days after blood feeding, (D) Expression of RpAnnex3 in PM at 1 and 7 days after blood feeding. Calibrators genes used in the relative quantification of gene expression were α-tubulin and GAPDH. Bars represent the mean ± the standard error of the mean (SEM) of two independent experiments with three pools of R. prolixus (n = 3). Means were compared applying Student’s t-test; **p < 0.01 and ***p < 0.001.

Similar articles

Cited by

References

    1. Albuquerque-Cunha J. M., Gonzalez M. S., Garcia E. S., Melllo C. B., Azambuja P., Almeida J. C. A., et al. (2009). Cytochemical characterization of microvillar and perimicrovillar membranes in the posterior midgut epithelium of Rhodnius prolixus. Arthropod. Struct. Dev. 38 31–44. 10.1016/j.asd.2008.06.001 - DOI - PubMed
    1. Alves C. R., Albuquerque-Cunha J. M., Mello C. B., Garcia E. S., Nogueira N. F. S., Bourguingnon S. C., et al. (2007). Trypanosoma cruzi: attachment to perimicrovillar membrane glycoproteins of Rhodnius prolixus. Exp. Parasitol. 116 44–52. 10.1016/j.exppara.2006.11.012 - DOI - PubMed
    1. Andries J. C., Torpier G. (1982). An extracellular brush border coat of lipid membranes in the midgut of Nepa cinérea (Insecta: Heteroptera): ultrastructure and genesis. Biol. Cell 46 195–202. 10.1002/9780470720769.ch12 - DOI - PubMed
    1. Antunes L. C. M., Han J., Pan J., Moreira C. J. C., Azambuja P., Borchers C. H., et al. (2013). Metabolomic signatures of Triatomine vectors of Trypanosoma cruzi unveiled by Metabolomics. PLoS One 8:e77283. 10.1371/journal.pone.0077283 - DOI - PMC - PubMed
    1. Araújo C. A., Waniek P. J., Stock P., Mayer C., Jansen A. M., Schaub G. A. (2006). Sequence characterization and expression patterns of defensin and lysozyme encoding genes from the gut of the reduviid bug Triatoma brasiliensis. Insect. Biochem. Mol. Biol. 36 547–560. 10.1016/j.ibmb.2006.04.003 - DOI - PubMed