. 2020 Dec 9:7:591873.
doi: 10.3389/fmolb.2020.591873. eCollection 2020.

Spike Proteins of SARS-CoV and SARS-CoV-2 Utilize Different Mechanisms to Bind With Human ACE2

Affiliations

Spike Proteins of SARS-CoV and SARS-CoV-2 Utilize Different Mechanisms to Bind With Human ACE2

Yixin Xie et al. Front Mol Biosci. .

Abstract

The ongoing outbreak of COVID-19 has been a serious threat to human health worldwide. The virus SARS-CoV-2 initiates its infection to the human body via the interaction of its spike (S) protein with the human Angiotensin-Converting Enzyme 2 (ACE2) of the host cells. Therefore, understanding the fundamental mechanisms of how SARS-CoV-2 S protein receptor binding domain (RBD) binds to ACE2 is highly demanded for developing treatments for COVID-19. Here we implemented multi-scale computational approaches to study the binding mechanisms of human ACE2 and S proteins of both SARS-CoV and SARS-CoV-2. Electrostatic features, including electrostatic potential, electric field lines, and electrostatic forces of SARS-CoV and SARS-CoV-2 were calculated and compared in detail. The results demonstrate that SARS-CoV and SARS-CoV-2 S proteins are both attractive to ACE2 by electrostatic forces even at different distances. However, the residues contributing to the electrostatic features are quite different due to the mutations between SARS-CoV S protein and SARS-CoV-2 S protein. Such differences are analyzed comprehensively. Compared to SARS-CoV, the SARS-CoV-2 binds with ACE2 using a more robust strategy: The electric field line related residues are distributed quite differently, which results in a more robust binding strategy of SARS-CoV-2. Also, SARS-CoV-2 has a higher electric field line density than that of SARS-CoV, which indicates stronger interaction between SARS-CoV-2 and ACE2, compared to that of SARS-CoV. Key residues involved in salt bridges and hydrogen bonds are identified in this study, which may help the future drug design against COVID-19.

Keywords: ACE2; COVID-19; SARS; SARS-CoV-2; angiotensin-converting enzyme 2; molecular dynamic; protein- protein interactions; spike protein.


Conflict of interest statement

The authors declare that the research was conducted in the absence of any commercial or financial relationships that could be construed as a potential conflict of interest.

Figures

Figure 1
Figure 1
Structure of SARS-CoV-2 S proteins and ACE2 binding domain. (A) The structure of S protein trimer binding with ACE2 binding domain. ACE2 is shown in gray color. The three S protein monomers are represented in yellow, orange, and green colors, respectively. The mutations from SARS-CoV to SARS-CoV-2 in this study are labeled in four colors on a single chain of S protein: Red represents residues which are mutated to be more negative; Blue represents residues which are mutated to be more positive; yellow represents residues which are mutated from polar to hydrophobic; cyan represents residues which are mutated from hydrophobic to polar. (B) Structure of a single S protein monomer. The RBD shown in red circle is flipping out to reach ACE2. The green circle region highlights the hinge between RBD and the rest of S protein.
Figure 2
Figure 2
Complex structures of S protein RBDs and ACE2 protein. (A) SARS-CoV S protein RBD (purple) and SARS-CoV-2 S protein RBD (yellow) bind with human ACE2 binding domain (gray); (B) A closeup view of (A), the interface area of SARS-CoV S protein RBD (purple) and SARS-CoV-2 S protein RBD (yellow) with human ACE2 binding domain (gray).
Figure 3
Figure 3
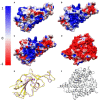
Electrostatic surfaces of SARS-CoV S protein RBD, SARS-CoV-2 S protein RBD and ACE2 RBD. (A) Electrostatic surface of SARS-CoV S protein RBD; (B) Electrostatic surface of SARS-CoV-2 S protein RBD; (C) Electrostatic difference between SARS- CoV and SARS-CoV-2 S protein RBD, by subtracting electrostatic values of SARS-CoV-2 by SARS-CoV, and mapped the values on the surface of SARS-CoV-2; (D) Electrostatic surface of human ACE2 RBD; (E) Structure comparison of SARS-CoV S protein RBD and SARS-CoV-2 S protein RBD, colored with purple and yellow, respectively; (F) The structure of human ACE2 binding domain, colored with gray.
Figure 4
Figure 4
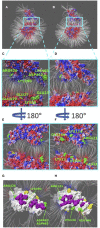
Electric filed lines at the interfaces of S protein RBDs and ACE2. (A) An overview of electric filed lines between SARS-CoV S protein RBD and ACE2 RBD; (B) An overview of electric field lines between SARS-CoV-2 S protein RBD and ACE2 RBD; (C) A closeup view of (A), with marked key residues that form salt bridges (ARG426-GLU329, LYS390-GLU37, ASP463-LYS26, LYS465-GLU23); (D) A closeup view of (B); (E) The back view of (C); (F) The back view of (D) with marked key residues that form salt bridges (GLU166-LYS13, LYS134-ASP20, ARG121-GLU31). The electrostatic surfaces and field lines are rendered by Visual Molecular Dynamics (VMD) (Li et al., 2013) with a color scale from −1.0 to 1.0 kT/Å. To present field lines in the clearest way, we adjusted gradient values to 2.39 kT/(eÅ), in (A,B, E,F), and 2.08 in (C,D,G,H). Negatively and positively charged areas are colored in red and blue, respectively; (G) The bottom view of SARS-CoV S protein RBD, salt bridge involved residues are marked green, hydrogen bond involved residues are marked purple, and yellow regions are special residues that have high density of field lines but they are not involved in salt bridges nor hydrogen bonds; (H) The bottom view of SARS-CoV-2 S protein RBD, salt bridge involved residues are marked green, hydrogen bond involved residues are marked purple, and yellow regions are special residues that have high density of field lines but they are not involved in salt bridges nor hydrogen bonds.
Figure 5
Figure 5
Electrostatic forces of SARS-CoV S protein RBD and SARS-CoV-2 S protein RBD at variable distances with human ACE2 binding domain. (A) Electrostatic forces of SARS-CoV S protein RBD with human ACE2 RBD at a different distance, from 5 to 40 with a step of 2 Å, where blue arrows show the net force directions. (B) Electrostatic forces of SARS-CoV-2 S protein RBD with human ACE2 RBD at different distance, from 5 to 40 with a step of 2 Å, where blue arrows show the net force directions. (C) Electrostatic forces of SARS-CoV S protein RBD with human ACE2 RBD at a distance 5 Å, where the blue arrow shows the total net force between S protein and ACE2, and red arrows represent individual forces between single residues of S proteins in interface area and ACE2. (D) Electrostatic forces of SARS-CoV-2 S protein RBD with human ACE2 RBD at a distance of 5 Å, where the blue arrow shows the total net force between S protein and ACE2, and red arrows represent individual forces between single residues of S proteins in interface area and ACE2. (E) A closeup view of (C) in the interface. (F) A closeup view of (D) in the interface.
Figure 6
Figure 6
The trends of total electrostatic forces between S protein RBDs and human ACE2 RBD at different distances from 5 to 40 Å. (A) Total electrostatic force between SARS-CoV S protein RBD and human ACE2 binding domain. (B) Total electrostatic force between SARS-CoV-2 S protein RBD with human ACE2 RBD.
Figure 7
Figure 7
Hydrogen bonds at interfaces of S protein RBDs and ACE2 RBD with their occupancies. (A) Number of hydrogen bonds between SARS-CoV S protein RBD and ACE2 binding domain during the MD simulation. The average number of hydrogen bonds is shown as a red line, with the value of 25.90 pairs. (B) Number of hydrogen bonds between SARS-CoV-2 S protein RBD and ACE2 binding domain in the MD simulation. The average number of hydrogen bonds is 21.85, shown as the red line; (C) Occupancies of 30 pairs of hydrogen bonds (with a cutoff value of 30%) forming at the interface of SARS-CoV S protein RBD and ACE2 protein binding domain. (D) Occupancies of 22 pairs of hydrogen bonds forming at the interface of SARS-CoV-2 S protein RBD and ACE2 protein binding domain. For each hydrogen bond pair, the residue on the left is from S protein RBD while that on the right is from ACE2.
Figure 8
Figure 8
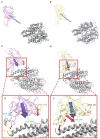
Structural demonstration of key residues that form salt bridges in the interface on both virus S protein RBDs and ACE2 RBD. (A) SARS-CoV S protein RBD (purple) and human ACE2 RBD (gray). (B) SARS-CoV-2 S protein RBD (yellow) and human ACE2 RBD (gray). Blue stands for positively charged key residues while red represents the negatively charged key residues.

References

    1. Arkhipov A., Freddolino P. L., Schulten K. (2006). Stability and dynamics of virus capsids described by coarse-grained modeling. Structure 14, 1767–1777. 10.1016/j.str.2006.10.003 - DOI - PubMed
    1. Biasini M., Bienert S., Waterhouse A., Arnold K., Studer G., Schmidt T., et al. . (2014). SWISS-MODEL: modelling protein tertiary and quaternary structure using evolutionary information. Nucleic Acids Res. 42, W252–W258. 10.1093/nar/gku340 - DOI - PMC - PubMed
    1. Brielle E. S., Schneidman-Duhovny D., Linial M. (2020). The SARS-CoV-2 exerts a distinctive strategy for interacting with the ACE2 human receptor. Viruses 12:497. 10.3390/v12050497 - DOI - PMC - PubMed
    1. Dolinsky T. J., Nielsen J. E., McCammon J. A., Baker N. A. (2004). PDB2PQR: an automated pipeline for the setup of Poisson–Boltzmann electrostatics calculations. Nucl. Acids Res. 32(Suppl_2), W665–W667. 10.1093/nar/gkh381 - DOI - PMC - PubMed
    1. Fehr A. R., Perlman S. (2015). Coronaviruses: an overview of their replication and pathogenesis, in Coronaviruses, Department of Microbiology, University of Iowa Carver College of Medicine (Iowa: Springer; ), 1–23.