Review
. 2020 Nov;476(2243):20200351.
doi: 10.1098/rspa.2020.0351. Epub 2020 Nov 25.

Environmental sustainability of biofuels: a review

Affiliations
Review

Environmental sustainability of biofuels: a review

Harish K Jeswani et al. Proc Math Phys Eng Sci. 2020 Nov.

Abstract

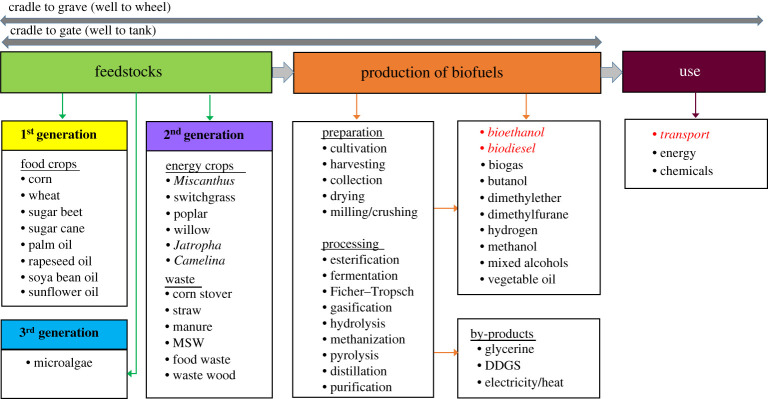
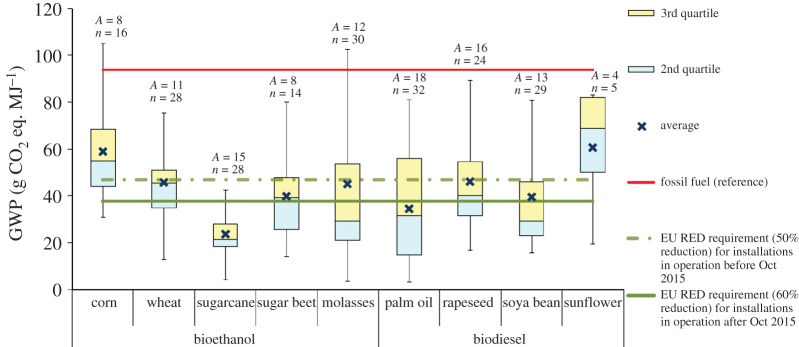
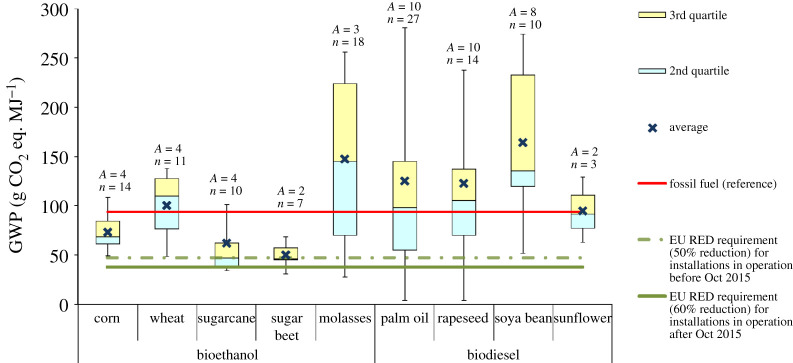
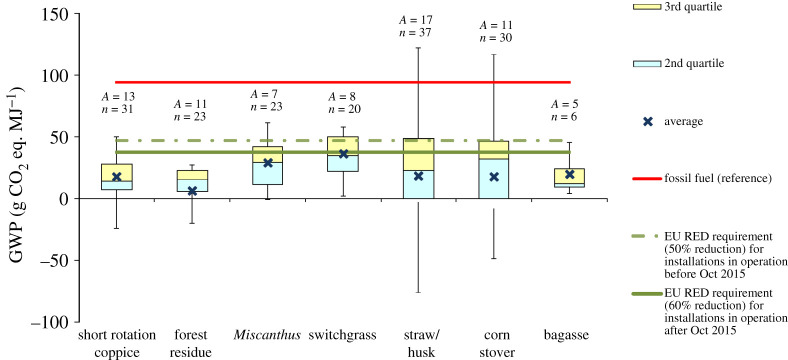
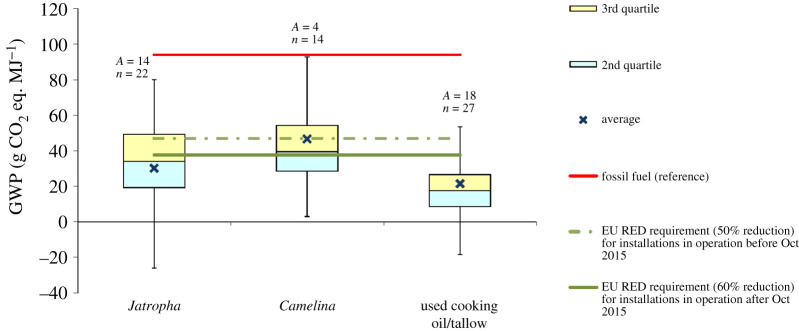
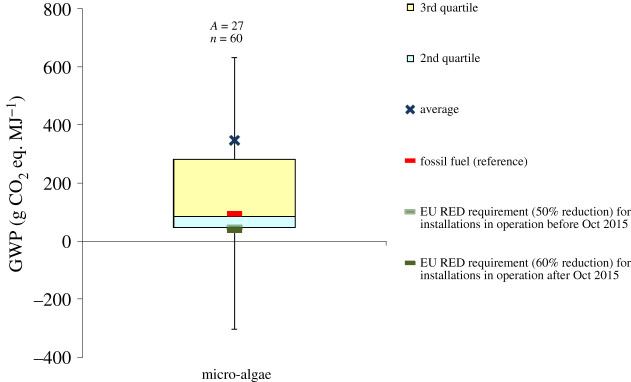
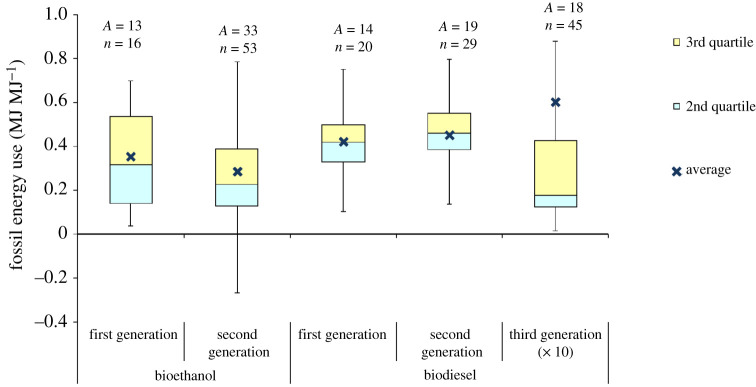
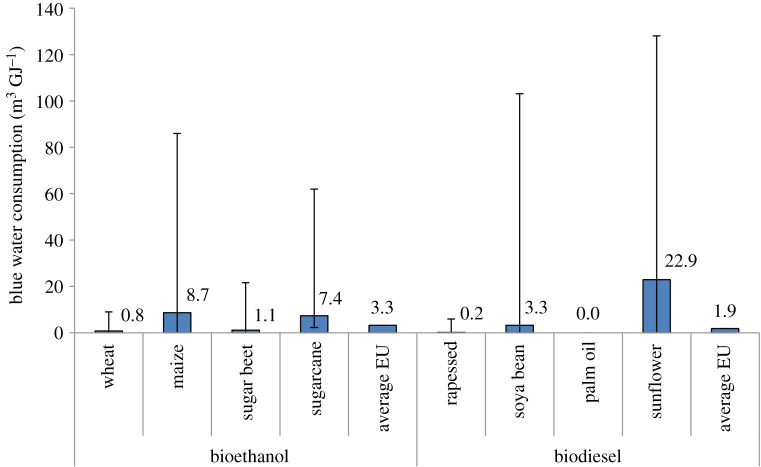
Biofuels are being promoted as a low-carbon alternative to fossil fuels as they could help to reduce greenhouse gas (GHG) emissions and the related climate change impact from transport. However, there are also concerns that their wider deployment could lead to unintended environmental consequences. Numerous life cycle assessment (LCA) studies have considered the climate change and other environmental impacts of biofuels. However, their findings are often conflicting, with a wide variation in the estimates. Thus, the aim of this paper is to review and analyse the latest available evidence to provide a greater clarity and understanding of the environmental impacts of different liquid biofuels. It is evident from the review that the outcomes of LCA studies are highly situational and dependent on many factors, including the type of feedstock, production routes, data variations and methodological choices. Despite this, the existing evidence suggests that, if no land-use change (LUC) is involved, first-generation biofuels can-on average-have lower GHG emissions than fossil fuels, but the reductions for most feedstocks are insufficient to meet the GHG savings required by the EU Renewable Energy Directive (RED). However, second-generation biofuels have, in general, a greater potential to reduce the emissions, provided there is no LUC. Third-generation biofuels do not represent a feasible option at present state of development as their GHG emissions are higher than those from fossil fuels. As also discussed in the paper, several studies show that reductions in GHG emissions from biofuels are achieved at the expense of other impacts, such as acidification, eutrophication, water footprint and biodiversity loss. The paper also investigates the key methodological aspects and sources of uncertainty in the LCA of biofuels and provides recommendations to address these issues.

Keywords: biofuels; carbon footprint; environmental impacts; life cycle assessment; sustainability; transport.


Conflict of interest statement

We declare we have no competing interests.

Figures

Figure 1.
Figure 1.
An overview of feedstocks and production processes for different biofuels, also showing the life cycle of fuels from cradle to gate (well to tank) and cradle to grave (well to wheel). Adapted from [14]. The figure has been simplified and other feedstocks, production routes, products/by-products and uses are possible. The italic font denotes the focus of this review, i.e. bioethanol and biodiesel used for transportation. DDGS, dark distillers grain with solids. (Online version in colour.)
Figure 2.
Figure 2.
GWP of first-generation biofuels without land-use change. Based on data from [,,,–118]. For the box plot legend, see electronic supplementary material, figure S1 and for the data used to plot this graph, see electronic supplementary material, figure S2. ‘Fossil fuel (reference)’ is the average carbon intensity of petrol and diesel supplied in the EU (94 g CO2 eq. MJ−1) as specified in the RED [8]. ‘A’ refers to the number of LCA articles found in the literature and ‘n’ denotes the total number of analyses. (Online version in colour.)
Figure 3.
Figure 3.
GWP of first-generation biofuels with land-use change. Based on data from [,,,,,,–,–,,,,,,,–127]. For the box plot legend, see electronic supplementary material, figure S1 and for the data used to plot this graph, see electronic supplementary material, figure S3. ‘Fossil fuel (reference)’ is the average carbon intensity of petrol and diesel supplied in the EU (94 g CO2 eq. MJ−1) as specified in the RED [8]. ‘A’ refers to the number of LCA articles found in the literature and ‘n’ denotes the total number of analyses. (Online version in colour.)
Figure 4.
Figure 4.
GWP of second-generation bioethanol. Based on data from [,,,,,,,,,,,,,,–163]. The negative values are due to the credits for co-products, such as heat and chemicals. For the box plot legend, see electronic supplementary material, figure S1 and for the data used to plot this graph, see electronic supplementary material, figure S4. ‘Fossil fuel (reference)’ is the average carbon intensity of petrol and diesel supplied in the EU (94 g CO2 eq. MJ−1) as specified in the RED [8]. ‘A’ refers to the number of LCA articles found in the literature and ‘n’ denotes the total number of analyses. (Online version in colour.)
Figure 5.
Figure 5.
GWP of second-generation biodiesel. Based on data from [,,,,,,–189]. The negative values are due to the credits for co-products. For the box plot legend, see electronic supplementary material, figure S1 and for the data used to plot this graph, see electronic supplementary material, figure S5. ‘Fossil fuel (reference)’ is the average carbon intensity of petrol and diesel supplied in the EU (94 g CO2 eq. MJ−1) as specified in the RED [8]. ‘A’ refers to the number of LCA articles found in the literature and ‘n’ denotes the total number of analyses. (Online version in colour.)
Figure 6.
Figure 6.
GWP of microalgae biodiesel. Based on data from [,,,,,,–209]. The negative values are due to the credits for co-products and avoided processes, such as wastewater treatment. For the box plot legend, see electronic supplementary material, figure S1 and for the data used to plot this graph, see electronic supplementary material, figure S6. ‘Fossil fuel (reference)’ is the average carbon intensity of petrol and diesel supplied in the EU (94 g CO2 eq. MJ−1) as specified in the RED [8]. ‘A’ refers to the number of LCA articles found in the literature and ‘n’ denotes the total number of analyses. (Online version in colour.)
Figure 7.
Figure 7.
Fossil energy use in the life cycle of biofuels. Based on data from [–,,,,,,,,,,,,,,,,,,,,,–,,,,,,,,,,,,–,,,,,–,–,,, –,,–,–,,,,–223]. For the box plot legend, see electronic supplementary material, figure S1 and for the data used to plot this graph, see electronic supplementary material, figure S7. The value for third-generation biodiesel should be multiplied by 10 to obtain the actual value. ‘A’ refers to the number of LCA articles found in the literature and ‘n’ denotes the total number of analyses. (Online version in colour.)
Figure 8.
Figure 8.
Blue water consumption for biofuels consumed in Europe. Based on data from [232]. Data labels represent the average values. (Online version in colour.)

References

    1. Sims R. et al 2014. Transport. In Climate change 2014: mitigation of climate change contribution of working group III to the fifth assessment report of the intergovernmental panel on climate change (eds Edenhofer O, et al.). Cambridge, UK: and New York, NY: Cambridge University Press.
    1. IEA. 2019. Renewables 2019. Paris: See https://www.iea.org/reports/renewables-2019.
    1. Michael K, Steffi N, Peter D. 2011. The past, present, and future of biofuels—biobutanol as promising alternative. In Biofuel production—recent developments and prospects (ed. dos Santos MA.), pp. 451–486. Rijeka, Croatia: InTech.
    1. Soccol CR, Vandenberghe LPS, Costa B, Woiciechowski AL, de Carvalho JC, Medeiros ABP, Francisco AM, Bonomi LJ. 2005. Brazilian biofuel program: an overview. J. Sci. Ind. Res. 64, 897–904.
    1. Food and Agriculture Organization (FAO). 2013. Biofuels and the sustainability challenge: a global assessment of sustainability issues, trends and policies for biofuels and related feedstocks. Rome, Italy: Food and Agriculture Organization of the United Nations.