. 2020 Dec 8:11:587450.
doi: 10.3389/fendo.2020.587450. eCollection 2020.

Amniotic Membrane Extract Protects Islets From Serum-Deprivation Induced Impairments and Improves Islet Transplantation Outcome

Affiliations

Amniotic Membrane Extract Protects Islets From Serum-Deprivation Induced Impairments and Improves Islet Transplantation Outcome

Zhaoming Yang et al. Front Endocrinol (Lausanne). .

Abstract

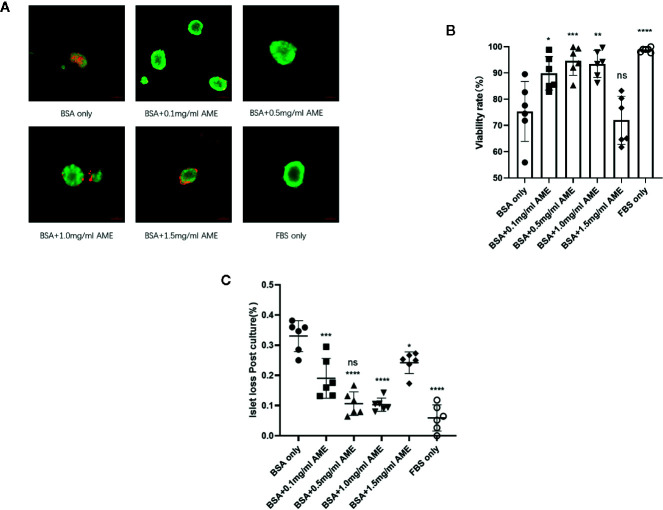
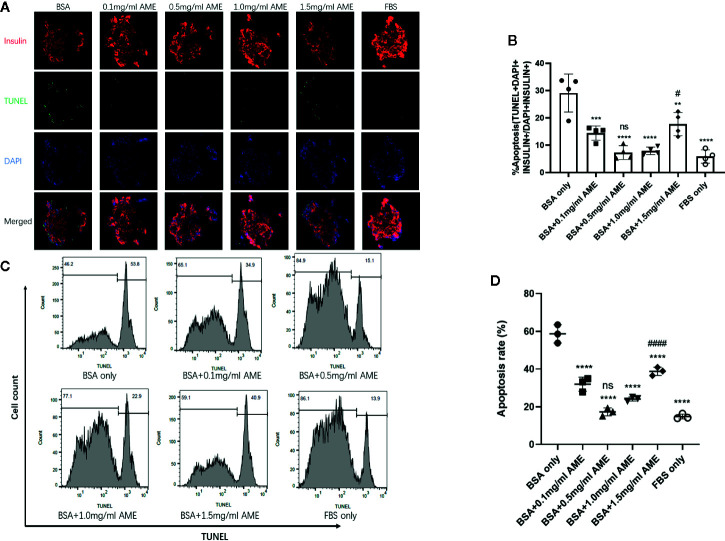
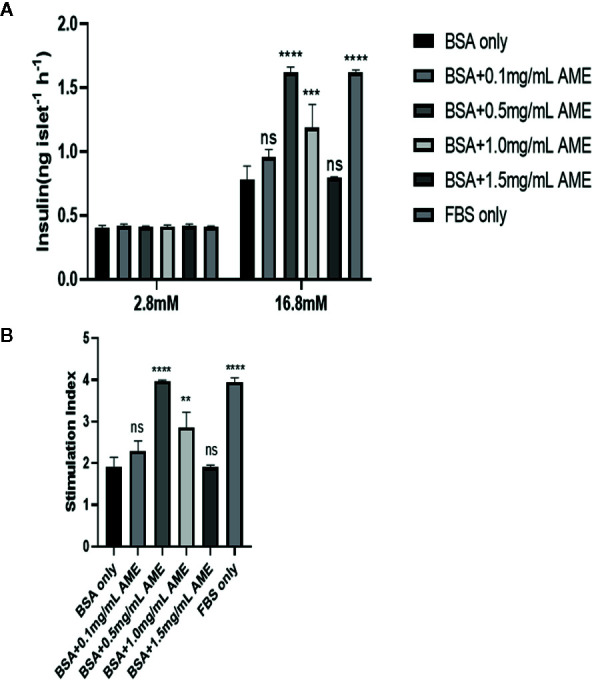
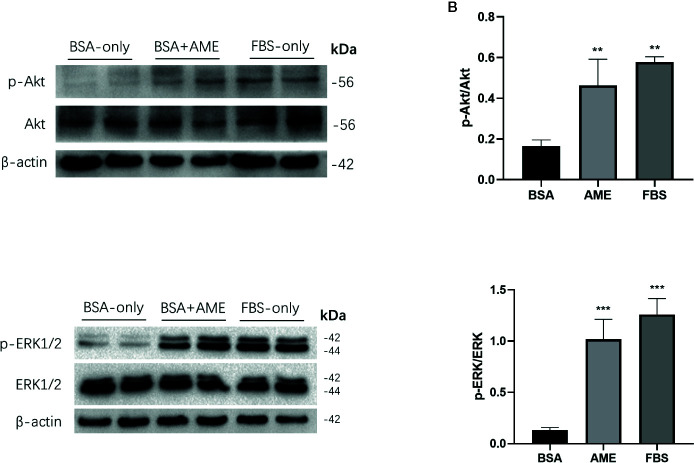
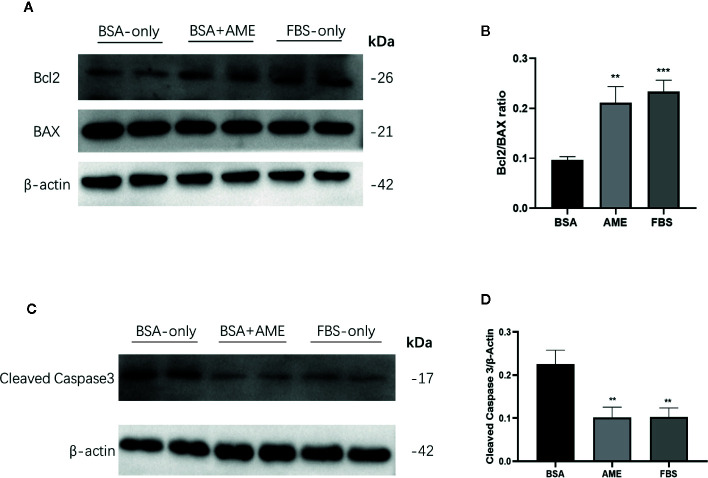
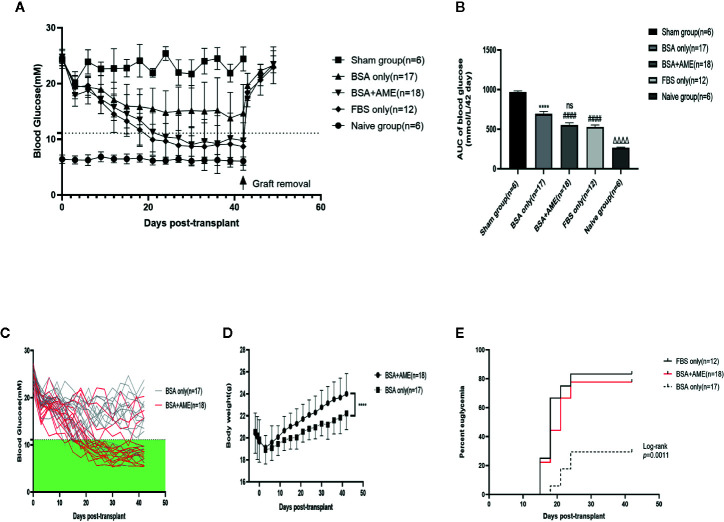
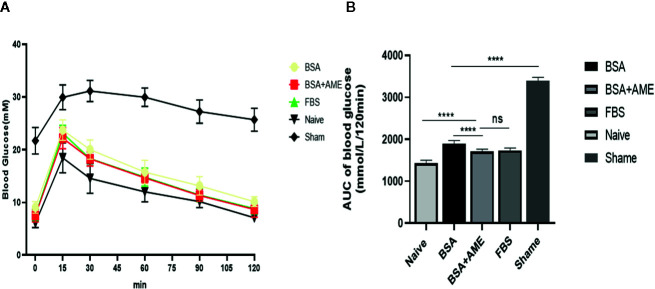
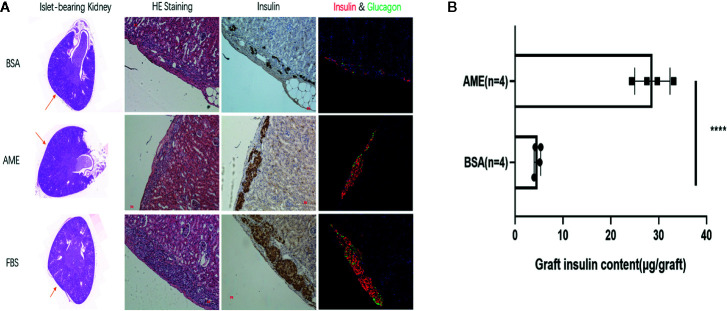
Islet culture prior to transplantation is a standard practice in many transplantation centers. Nevertheless, the abundant islet mass loss and function impairment during this serum-deprivation culture period restrain the success of islet transplantation. In the present study, we used a natural biomaterial derived product, amniotic membrane extract (AME), as medium supplementation of islet pretransplant cultivation to investigate its protective effect on islet survival and function and its underlying mechanisms, as well as the engraftment outcome of islets following AME treatment. Results showed that AME supplementation improved islet viability and function, and decreased islet apoptosis and islet loss during serum-deprived culture. This was associated with the increased phosphorylation of PI3K/Akt and MAPK/ERK signaling pathway. Moreover, transplantation of serum-deprivation stressed islets that were pre-treated with AME into diabetic mice revealed better blood glucose control and improved islet graft survival. In conclusion, AME could improve islet survival and function in vivo and in vitro, and was at least partially through increasing phosphorylation of PI3K/Akt and MAPK/ERK signaling pathway.

Keywords: amniotic membrane extract; apoptosis; islet transplantation; serum-deprivation; type 1 diabetes.


Conflict of interest statement

The authors declare that the research was conducted in the absence of any commercial or financial relationships that could be construed as a potential conflict of interest.

Figures

Figure 1
Figure 1
AME significantly increased the viability and recovery of serum-deprived islets (A). Representative images are showing AO/EB staining of isolated islets after 48 h cultivation. Viable cells are stained as green (B). The percentage of viable cells was significantly increased with AME treatment (*p < 0.05, **p < 0.01, ***p < 0.001, ****p < 0.0001 and ns vs. BSA only group, One-way ANOVA). Results are shown as means ± SD of six independent experiments, with 75–100 islets/condition for each independent experiment. Scale bar: 100 μm (C). The percentage of islet loss post 48-h cultivation in vitro (***p < 0.001, ****p < 0.0001, ****p < 0.0001, *p < 0.05, and ****p < 0.0001 vs. BSA only group, and ns vs. FBS only group, One-way ANOVA). Results are shown as means ± SD of six independent experiments, with 75–100 islets/condition for each independent experiment.
Figure 2
Figure 2
AME significantly decreased the apoptosis rate of serum-deprived islets (A). Representative images are showing TUNEL staining of isolated islets after 48 h cultivation. Insulin (red), apoptosis (green), and nucleus/DAPI (blue) were stained for the analysis (B). The percentage of apoptosis was calculated as TUNEL+DAPI+Insulin+/DAPI+Insulin+. (**p < 0.01, ***p < 0.001, and ****p < 0.0001 vs. BSA only group. #p < 0.05 vs. BSA + 0.5 mg/ml AME, and ns vs. FBS only group, One-way ANOVA). Results are shown as means ± SD of four independent experiments, with 15–20 islets/condition for each independent experiment (C). Detection of DNA fragmentation (TUNEL staining) by flow cytometry (D). The percentage of apoptotic cells determined by flow cytometry following trypsin digestion. (****p < 0.0001 vs. BSA only group. ####p < 0.0001 vs. BSA + 0.5 mg/ml AME group, and ns vs. FBS only group, One-way ANOVA). Results are shown as means ± SD of three independent experiments.
Figure 3
Figure 3
Glucose-stimulated insulin release assay and stimulation index analysis (A). After 48 h cultivation, 10 islets were picked from each group and assayed for GSIS. The improvement of insulin secretory function by AME peaked at the concentration of 0.5 mg/ml (***p < 0.001, ****p < 0.0001, and ns vs. BSA only group, Two-way ANOVA) (B). The stimulation index was calculated (**p < 0.01, ****p < 0.0001, and ns vs. BSA only group, One-way ANOVA). Results are shown as means ± SD of three independent experiments.
Figure 4
Figure 4
AME increased the phosphorylation of Akt and ERK1/2. (A, C) Protein levels of p-Akt, Akt, p-ERK1/2, and ERK1/2 were assessed by Western Blot (B). and (D) Quantification of protein levels showed the enhanced expression of Akt and ERK1/2 after AME (0.5 mg/ml) treatment (**p < 0.01 and ***p < 0.001 compared to BSA only group, One-way ANOVA). Results are shown as means ± SD of three independent experiments.
Figure 5
Figure 5
AME increased Bcl2/BAX ratio and decreased the expression of cleaved caspase-3 (A). and (C) Protein levels of Bcl2, Bax, cleaved caspase-3, and β-actin were assessed by Western Blot (B). and (D) Quantification of protein levels showed the enhanced expression of Bcl2 after AME (0.5 mg/ml) treatment, while there was no significant change of the expression level of Bax (p > 0.05, One-way ANOVA). Further analysis of Bcl2/Bax ratio showed that AME significantly increased Bcl2/Bax ratio of serum-deprived islets (**p < 0.01 and ***p < 0.001 compared to BSA only group, one-way ANOVA). And the expression of cleaved caspase-3 was significantly decreased after AME treatment (**p < 0.01 vs. BSA only group, One-way ANOVA). Results are shown as means ± SD of three independent experiments.
Figure 6
Figure 6
Regulation of recipient blood glucose. Islets were cultured in different conditions (BSA only, BSA + AME [0.5 mg/ml], and FBS only) prior to transplantation. Non-fasting blood glucose was measured every 3 days post-transplantation (A). Non-fasting blood glucose curves of islet recipients and the control group. Data are shown as means ± SD. The dotted line indicates the level of 11.1 mmol/l (B). AUC of non-fasting blood glucose, expressed as mmol/L/42days (####p < 0.0001 and ns when BSA + AME group [N = 18] was compared to BSA only [N = 17] and FBS only group [N = 12]; ****p < 0.0001 when BSA only group was compared to the Sham group [N = 6]; ΔΔΔΔp < 0.0001 when Naïve group [N = 6] was compared to BSA + AME and FBS only group, One-way ANOVA) (C). Non-fasting blood glucose of individual recipients in BSA only and BSA + AME group (D). Body weight monitoring of graft recipients in BSA + AME and BSA only group (****p < 0.0001 when BSA + AME group [N = 18] was compared to the BSA only [N = 17] group, Unpaired t-test) (E). The percentage of recipients achieving euglycemia. p = 0.0016 for the post hoc comparison of BSA only and BSA + AME group. p = 0.5270 for the post hoc comparison of BSA+AME and FBS only group (Log-rank [Mantel-Cox] test).
Figure 7
Figure 7
Intraperitoneal glucose tolerance test of islet grafts pre-cultured under different conditions (A). Blood glucose was measured at 0, 15, 30, 60, 90, and 120 min after dextrose I.P. administration. Data points are shown as mean ± SD (B). Areas under the curve of blood glucose tolerance test, expressed as mmol/L/120 min (****p < 0.0001, ns and ****p < 0.0001 when BSA + AME group [N = 14] was compared to BSA only [N = 5], FBS only [N = 10], and Naïve group [N = 6], respectively. ****p < 0.0001 when BSA only group was compared to the Sham group [N = 6] One-way ANOVA).
Figure 8
Figure 8
Histological analysis of islet graft and islet graft insulin content assay (A). HE, immunohistochemistry, and immunofluorescence staining of islet grafts. Scale bar: 20 μm (B). Islet grafts were harvested and homogenized to obtain the total insulin content of the grafts (****p < 0.0001 when BSA + AME [N = 4] group was compared to BSA only [N = 4], Unpaired t-test).

Similar articles

Cited by

References

    1. Shapiro AM, Pokrywczynska M, Ricordi C. Clinical pancreatic islet transplantation. Nat Rev Endocrinol (2017) 13(5):268–77. 10.1038/nrendo.2016.178 - DOI - PubMed
    1. Shapiro AM, Lakey JR, Ryan EA, Korbutt GS, Toth E, Warnock GL, et al. Islet transplantation in seven patients with type 1 diabetes mellitus using a glucocorticoid-free immunosuppressive regimen. N Engl J Med (2000) 343(4):230–8. 10.1056/NEJM200007273430401 - DOI - PubMed
    1. Vantyghem MC, de Koning EJP, Pattou F, Rickels MR. Advances in β-cell replacement therapy for the treatment of type 1 diabetes. Lancet (2019) 394(10205):1274–85. 10.1016/S0140-6736(19)31334-0 - DOI - PMC - PubMed
    1. Eich T, Eriksson O, Lundgren T. Visualization of early engraftment in clinical islet transplantation by positron-emission tomography. N Engl J Med (2007) 356(26):2754–5. 10.1056/NEJMc070201 - DOI - PubMed
    1. Pepper AR, Bruni A, Pawlick R, Wink J, Rafiei Y, Gala-Lopez B, et al. Engraftment Site and Effectiveness of the Pan-Caspase Inhibitor F573 to Improve Engraftment in Mouse and Human Islet Transplantation in Mice. Transplantation (2017) 101(10):2321–9. 10.1097/TP.0000000000001638 - DOI - PubMed

Publication types

MeSH terms