

Variation Between Three Eragrostis tef Accessions in Defense Responses to Rhopalosiphum padi Aphid Infestation
- PMID: 33363559
- PMCID: PMC7752923
- DOI: 10.3389/fpls.2020.598483
Variation Between Three Eragrostis tef Accessions in Defense Responses to Rhopalosiphum padi Aphid Infestation
Abstract
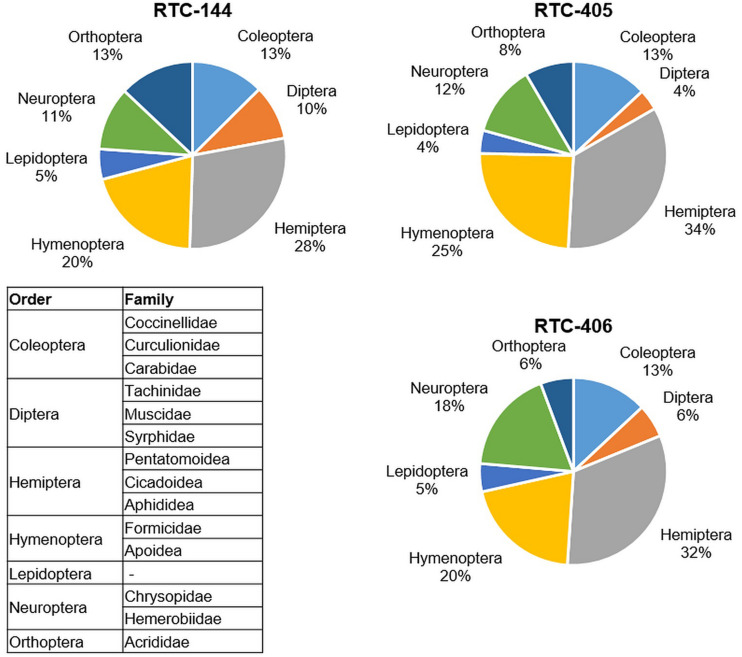
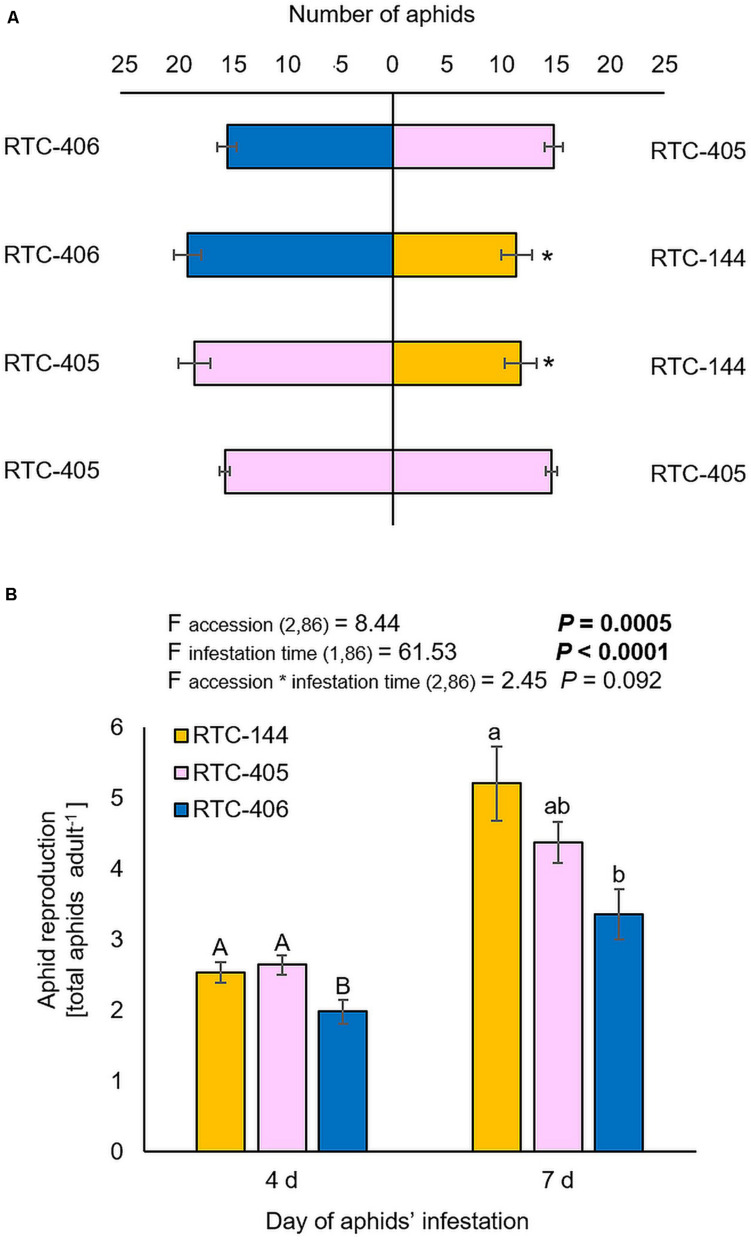
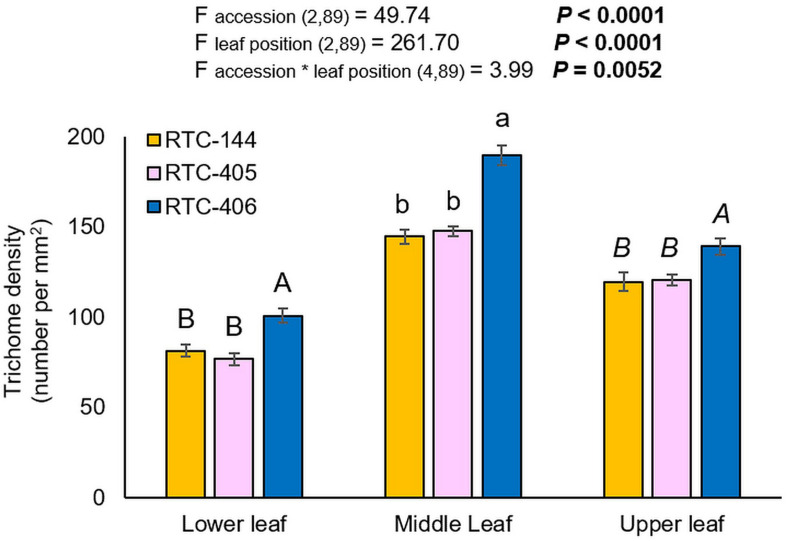
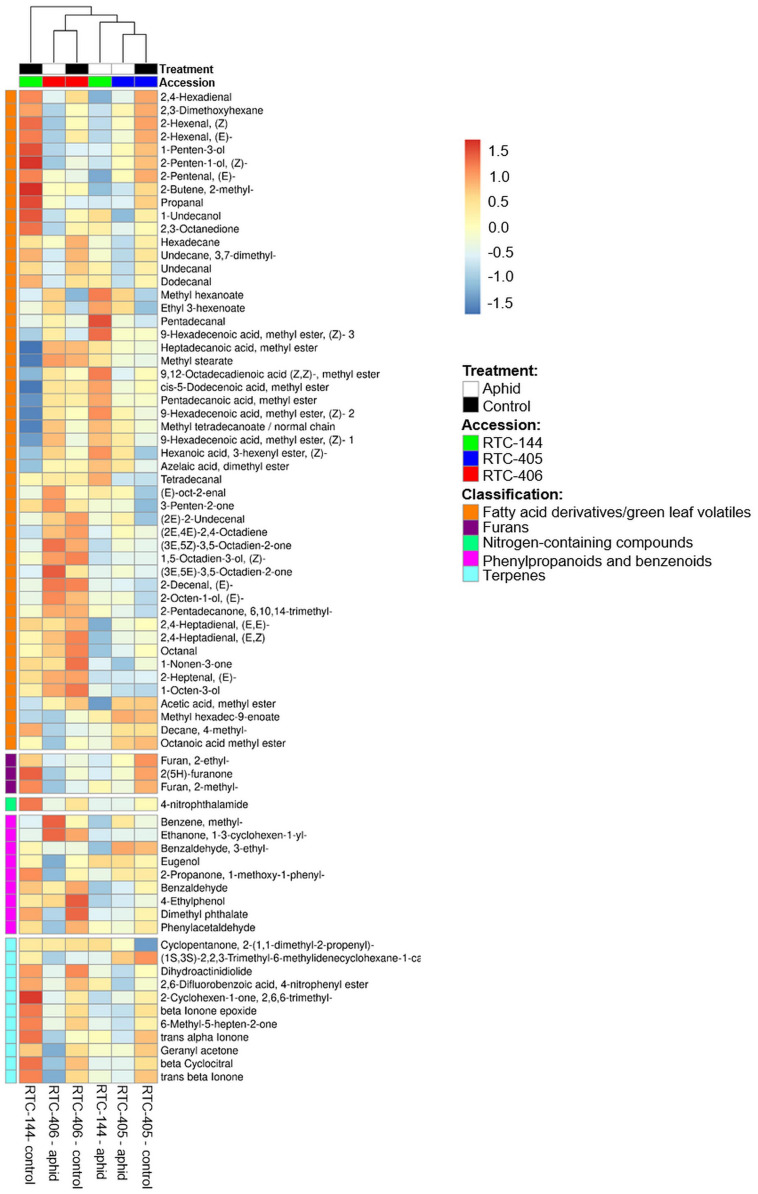
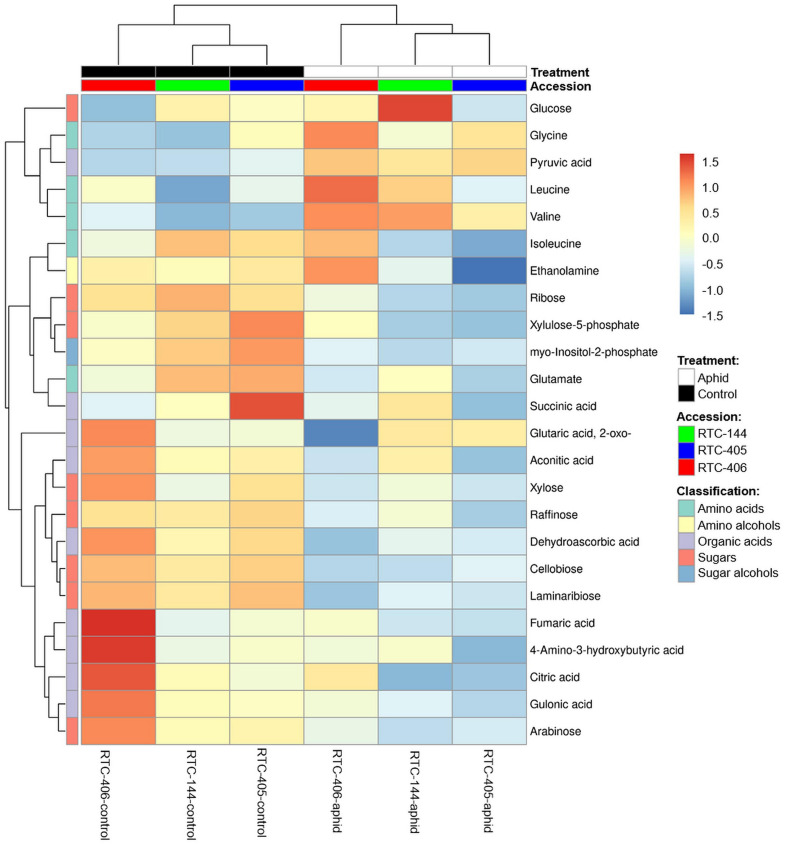
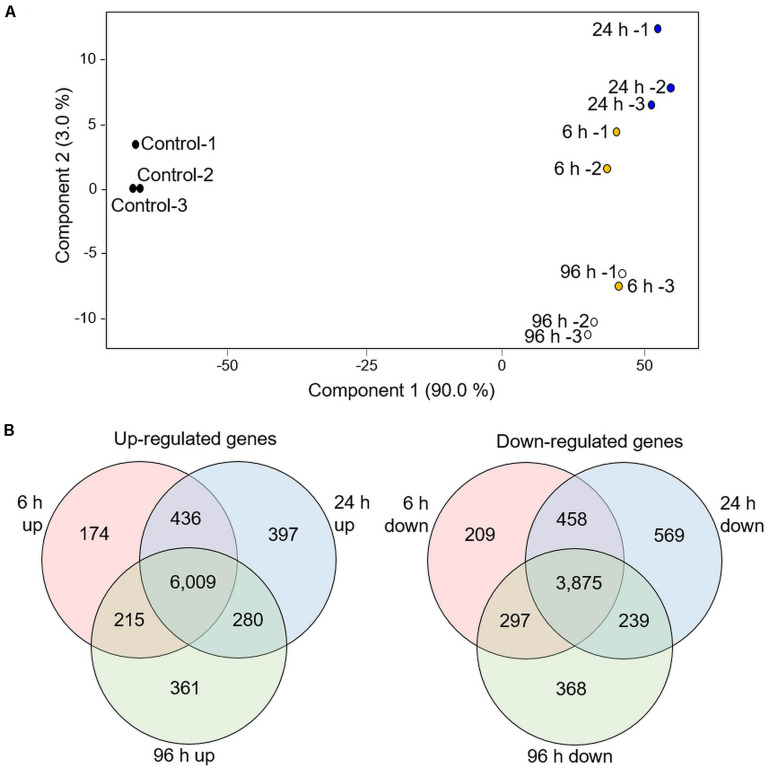
Tef (Eragrostis tef), a staple crop that originated in the Horn of Africa, has been introduced to multiple countries over the last several decades. Crop cultivation in new geographic regions raises questions regarding the molecular basis for biotic stress responses. In this study, we aimed to classify the insect abundance on tef crop in Israel, and to elucidate its chemical and physical defense mechanisms in response to insect feeding. To discover the main pests of tef in the Mediterranean climate, we conducted an insect field survey on three selected accessions named RTC-144, RTC-405, and RTC-406, and discovered that the most abundant insect order is Hemiptera. We compared the differences in Rhopalosiphum padi (Hemiptera; Aphididae) aphid performance, preference, and feeding behavior between the three accessions. While the number of aphid progeny was lower on RTC-406 than on the other two, the aphid olfactory assay indicated that the aphids tended to be repelled from the RTC-144 accession. To highlight the variation in defense responses, we investigated the physical and chemical mechanisms. As a physical barrier, the density of non-granular trichomes was evaluated, in which a higher number of trichomes on the RTC-406 than on the other accessions was observed. This was negatively correlated with aphid performance. To determine chemical responses, the volatile and central metabolite profiles were measured upon aphid attack for 4 days. The volatile analysis exposed a rich and dynamic metabolic profile, and the central metabolism profile indicated that tef plants adjust their sugars and organic and amino acid levels. Overall, we found that the tef plants possess similar defense responses as other Poaceae family species, while the non-volatile deterrent compounds are yet to be characterized. A transcriptomic time-series analysis of a selected accession RTC-144 infested with aphids revealed a massive alteration of genes related to specialized metabolism that potentially synthesize non-volatile toxic compounds. This is the first report to reveal the variation in the defense mechanisms of tef plants. These findings can facilitate the discovery of insect-resistance genes leading to enhanced yield in tef and other cereal crops.
Keywords: aphid; cereal crop; electrical penetration graph; green leaf volatile; insect behavior; trichome; volatile organic compounds.
Copyright © 2020 Gyan, Yaakov, Weinblum, Singh, Cna’ani, Ben-Zeev, Saranga and Tzin.
Conflict of interest statement
The authors declare that the research was conducted in the absence of any commercial or financial relationships that could be construed as a potential conflict of interest.
Figures
References
-
- Agrawal A. A., Fishbein M., Jetter R., Salminen J.-P., Goldstein J. B., Freitag A. E., et al. (2009). Phylogenetic ecology of leaf surface traits in the milkweeds (Asclepias spp.): chemistry, ecophysiology, and insect behavior. New Phytol. 183 848–867. 10.1111/j.1469-8137.2009.02897.x - DOI - PubMed
-
- Agrawal A. A. (1999). “Induced plant defense: evolution of induction and adaptive phenotypic plasticity,” in Inducible Plant Defenses Against Pathogens and Herbivores: Biochemistry, Ecology, and Agriculture, eds Agrawal A. A., Tuzun S., Bent E. (St. Paul, MN: American Phytopathological Society Press; ), 251–268.
-
- Akol A. M., Njagi P. G. N., Sithanantham S., Mueke J. M. (2003). Effects of two neem insecticide formulations on the attractiveness, acceptability and suitability of diamondback moth larvae to the parasitoid, Diadegma mollipla (Holmgren) (Hym., Ichneumonidae). J. Appl. Entomol. 127 325–331. 10.1046/j.1439-0418.2003.00771.x - DOI
LinkOut - more resources
Full Text Sources
Other Literature Sources
Research Materials