. 2020 Dec 8:11:551787.
doi: 10.3389/fgene.2020.551787. eCollection 2020.

Epigenetic Variation Analysis Leads to Biomarker Discovery in Gastric Adenocarcinoma

Affiliations

Epigenetic Variation Analysis Leads to Biomarker Discovery in Gastric Adenocarcinoma

Yan Zhang et al. Front Genet. .

Abstract

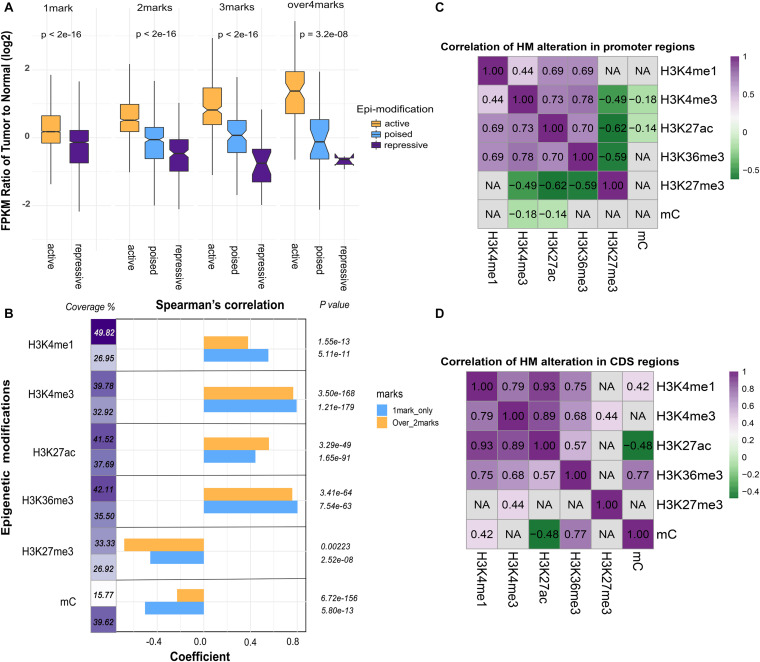
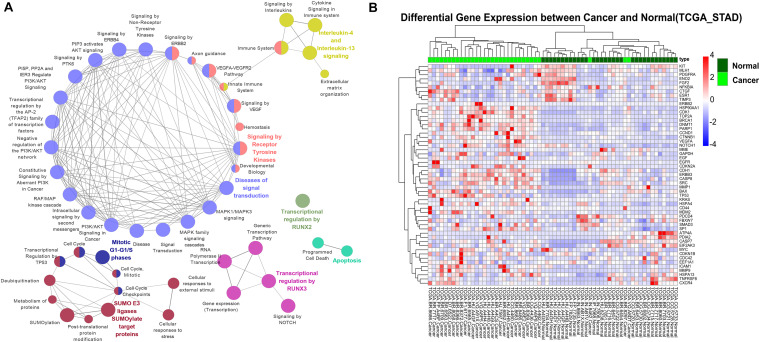
As one of the most common malignant tumors worldwide, gastric adenocarcinoma (GC) and its prognosis are still poorly understood. Various genetic and epigenetic factors have been indicated in GC carcinogenesis. However, a comprehensive and in-depth investigation of epigenetic alteration in gastric cancer is still missing. In this study, we systematically investigated some key epigenetic features in GC, including DNA methylation and five core histone modifications. Data from The Cancer Genome Atlas Program and other studies (Gene Expression Omnibus) were collected, analyzed, and validated with multivariate statistical analysis methods. The landscape of epi-modifications in gastric cancer was described. Chromatin state transition analysis showed a histone marker shift in gastric cancer genome by employing a Hidden-Markov-Model based approach, indicated that histone marks tend to label different sets of genes in GC compared to control. An additive effect of these epigenetic marks was observed by integrated analysis with gene expression data, suggesting epigenetic modifications may cooperatively regulate gene expression. However, the effect of DNA methylation was found more significant without the presence of the five histone modifications in our study. By constructing a PPI network, key genes to distinguish GC from normal samples were identified, and distinct patterns of oncogenic pathways in GC were revealed. Some of these genes can also serve as potential biomarkers to classify various GC molecular subtypes. Our results provide important insights into the epigenetic regulation in gastric cancer and other cancers in general. This study describes the aberrant epigenetic variation pattern in GC and provides potential direction for epigenetic biomarker discovery.

Keywords: DNA methylation; biomarker; epigenetics; gastric cancer; histone modification.


Conflict of interest statement

The authors declare that the research was conducted in the absence of any commercial or financial relationships that could be construed as a potential conflict of interest.

Figures

FIGURE 1
FIGURE 1
The epigenetic alteration for different genomic features in GC. (A) The proportion of genomic regions occupied by different numbers of epigenetic alterations. In the upper pie chart, 61% of genomic region were occupied by 1 epigenetic mark, and the remaining regions were co-occupied by varying numbers of epigenetic marks. Base on the genomic region occupied by 1 mark, the lower pie chart showed the proportion of genomic regions occupied by different types of epigenetic marks. (B) Overview of co-localization for each epigenetic modification. The intersection area indicates the count of co-altered epigenetic modifications, corresponding to the number in the Venn diagram. Different types of epigenetic marks altered together were connected by black lines. (C) The percentage of genomic features with altered epigenetic modifications. Upregulated and downregulated epigenetic modifications were colored in purple and orange, respectively. (D) KEGG enrichment analysis for all DHMRs. The X-axis denotes different types of epigenetic modification.
FIGURE 2
FIGURE 2
Chromatin state analysis. (A) ChIP signals matrix showed the histone modification profiles of tumor samples and normal samples for the 19 states inferred by the ChromHMM algorithm. First column gave state number and candidate state description, and second column gave the state abbreviations. In the heatmap of the emission parameter, each row corresponded to a different state, and each column corresponded to a different histone mark. The darker blue color corresponded to a higher frequency of occurrence of the mark in the state on the scale from 0 (white) to 1 (blue). The heat map of Genomic annotations displays enrichment for various external genomic annotations. A darker green color corresponded to a higher enrichment on the genomic feature. Overlap of different genomic features (CpG island, Exon, Gene, Intron, TES_2kb, TES, TSS_2kb, TSS, ZNF genes) with chromatin state called in tumor and normal cells. TES indicated transcription end site, and TES_2kb indicated regions within 2kb of the TES. TSS indicated transcription start site, and TSS_2kb indicated regions within 2kb of TSS. (B) Heatmap showed the raw enrichment score of state transitions between normal and tumor samples. The color bars on the left and top corresponded to the color bar of state description in (A). “T” on left color bar indicated tumor sample, and “N” on the top color bar indicated normal samples. The frequent state transitions were highlighted with purple frame. (C) Heatmap showed normalized enrichment score of transitions of chromatin states from normal to GC samples. The color intensities range from white (relative enrichment < 1) to orange and blue (relative enrichment > 1). The normalized enrichment score of more than two were shown. The region with non-repressive states was labeled with orange color, and the region with the repressive state was labeled with a blue color with red frame.
FIGURE 3
FIGURE 3
The association between epigenetic modifications and gene expression. (A) Additive effects of epigenetic alterations on gene expression. Genes were grouped into active subgroups (orange), poised subgroups (blue), and repressive subgroups (purple). The X-axis denotes the counts and patterns of epigenetic marks, and the Y-axis shows the log2 FPKM fold change of gene expression. (B) The coefficient of Spearman’s correlation was calculated between epigenetic alterations and fold change of gene expression. Promoters of genes modified by only one epigenetic mark (blue) or more than two marks (orange) were indicated. The coverage denotes the proportion of genes in each category. (C) Pearson’s correlation analysis of paired epigenetic alterations at the promoter and (D) the coding DNA sequence (CDS) (P < 0.05). Non-significant results were denoted with “NA.”
FIGURE 4
FIGURE 4
The association between oncogenic pathways and epigenetic modifications. (A) The Reactome pathway enrichment analysis for 53 essential hub genes. (B) Hierarchical clustering of 64 gastric cancer samples (32 tumor samples and 32 corresponding non-tumor adjacent samples) from TCGA using expression profiles of epigenetically regulated genes in key signaling pathways.
FIGURE 5
FIGURE 5
Subtype-specific progression associated genes. (A) Kaplan-Meier estimates of overall survival rate for all samples (ALL), CIN, GS, EBV, and MSI subtype of TCGA patient cohort according to the expression pattern of subtype-specific genes in (B). Red line indicated that GC patients with high-risk scores were associated with a lower median survival rate, and green line indicated that GC patients with low-risk scores were associated with a higher median survival rate. (B) Subtype specific gastric cancer progression associated genes (P < 0.05 were shown). Red (Risky) indicated that higher gene expression associated with worse survival, and blue (Protective) indicated that higher gene expression associated with better survival.

Similar articles

Cited by

References

    1. Allis C., Jenuwein T. (2016). The molecular hallmarks of epigenetic. Perspectives 17 487–500. 10.1038/nrg.2016.59 - DOI - PubMed
    1. Aryee M. J., Jaffe A. E., Corrada-Bravo H., Ladd-Acosta C., Feinberg A. P., Hansen K. D., et al. (2014). Minfi: a flexible and comprehensive Bioconductor package for the analysis of Infinium DNA methylation microarrays. Bioinformatics 30 1363–1369. 10.1093/bioinformatics/btu049 - DOI - PMC - PubMed
    1. Barski A., Cuddapah S., Cui K., Roh T.-Y., Schones D. E., Wang Z., et al. (2007). High-resolution profiling of histone methylations in the human genome. Cell 129 823–837. 10.1016/j.cell.2007.05.009 - DOI - PubMed
    1. Benevolenskaya E. V. (2007). Histone H3K4 demethylases are essential in development and differentiation. Biochem. Cell Biol. 85 435–443. 10.1139/o07-057 - DOI - PubMed
    1. Bieche I., Olivi M., Nogues C., Vidaud M., Lidereau R. (2002). Prognostic value of CCND1 gene status in sporadic breast tumours, as determined by real-time quantitative PCR assays. Br. J. Cancer 86 580–586. 10.1038/sj.bjc.6600109 - DOI - PMC - PubMed