

Genome-Wide Association Mapping and Genomic Prediction of Anther Extrusion in CIMMYT Hybrid Wheat Breeding Program via Modeling Pedigree, Genomic Relationship, and Interaction With the Environment
- PMID: 33363570
- PMCID: PMC7755068
- DOI: 10.3389/fgene.2020.586687
Genome-Wide Association Mapping and Genomic Prediction of Anther Extrusion in CIMMYT Hybrid Wheat Breeding Program via Modeling Pedigree, Genomic Relationship, and Interaction With the Environment
Abstract
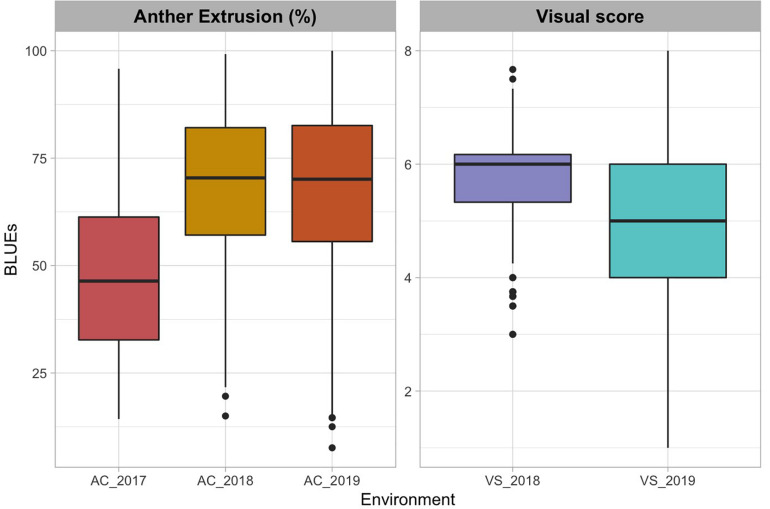
Anther extrusion (AE) is the most important male floral trait for hybrid wheat seed production. AE is a complex quantitative trait that is difficult to phenotype reliably in field experiments not only due to high genotype-by-environment effects but also due to the short expression window in the field condition. In this study, we conducted a genome-wide association scan (GWAS) and explored the possibility of applying genomic prediction (GP) for AE in the CIMMYT hybrid wheat breeding program. An elite set of male lines (n = 603) were phenotype for anther count (AC) and anther visual score (VS) across three field experiments in 2017-2019 and genotyped with the 20K Infinitum is elect SNP array. GWAS produced five marker trait associations with small effects. For GP, the main effects of lines (L), environment (E), genomic (G) and pedigree relationships (A), and their interaction effects with environments were used to develop seven statistical models of incremental complexity. The base model used only L and E, whereas the most complex model included L, E, G, A, and G × E and A × E. These models were evaluated in three cross-validation scenarios (CV0, CV1, and CV2). In cross-validation CV0, data from two environments were used to predict an untested environment; in random cross-validation CV1, the test set was never evaluated in any environment; and in CV2, the genotypes in the test set were evaluated in only a subset of environments. The prediction accuracies ranged from -0.03 to 0.74 for AC and -0.01 to 0.54 for VS across different models and CV schemes. For both traits, the highest prediction accuracies with low variance were observed in CV2, and inclusion of the interaction effects increased prediction accuracy for AC only. In CV0, the prediction accuracy was 0.73 and 0.45 for AC and VS, respectively, indicating the high reliability of across environment prediction. Genomic prediction appears to be a very reliable tool for AE in hybrid wheat breeding. Moreover, high prediction accuracy in CV0 demonstrates the possibility of implementing genomic selection across breeding cycles in related germplasm, aiding the rapid breeding cycle.
Keywords: GWAS; anther extrusion; floral traits; genome-wide prediction; hybrid wheat.
Copyright © 2020 Adhikari, Basnet, Crossa, Dreisigacker, Camarillo, Bhati, Jarquin, Manes and Ibrahim.
Conflict of interest statement
YM was employed by company Syngenta France S.A.S, France. The remaining authors declare that the research was conducted in the absence of any commercial or financial relationships that could be construed as a potential conflict of interest.
Figures

References
-
- Acosta-Pech R., Crossa J., de los Campos G., Teyssèdre S., Claustres B., Pérez-Elizalde S., et al. (2017). Genomic models with genotype×environment interaction for predicting hybrid performance: an application in maize hybrids. Theor. Appl. Genet. 130 1431–1440. 10.1007/s00122-017-2898-2890 - DOI - PubMed
-
- Adhikari A., Ibrahim A. M., Rudd J. C., Baenziger P. S., Sarazin J. (2020a). Estimation of heterosis and combining abilities of US winter wheat germplasm for hybrid development in Texas. Crop Sci. 60 788–803. 10.1002/csc2.20020 - DOI
-
- Adhikari A., Ibrahim A. M. H., Rudd J. C., Baenziger P. S., Easterly A., Garst N., et al. (2020b). Supplementing selection decisions in a hybrid wheat breeding program by using F2 yield as a proxy of F1 performance. Euphytica 216:130 10.1007/s10681-020-02664-0 - DOI
-
- Aisawi K. A. B., Reynolds M. P., Singh R. P., Foulkes M. J. (2015). The physiological basis of the genetic progress in yield potential of CIMMYT spring wheat cultivars from 1966 to 2009. Crop Sci. 55 1749–1764. 10.2135/cropsci2014.09.0601 - DOI
-
- Alvarado G., López M., Vargas M., Pacheco Á, Rodríguez F., Burgueño J., et al. (2015). META-R (Multi Environment Trail Analysis with R for Windows) Version 5.0. Mexico: International Maize and Wheat Improvement Center (CIMMYT).
LinkOut - more resources
Full Text Sources