. 2020 Dec 3:18:4063-4070.
doi: 10.1016/j.csbj.2020.11.040. eCollection 2020.

Derivation of a nuclear heterogeneity image index to grade DCIS

Affiliations

Derivation of a nuclear heterogeneity image index to grade DCIS

Mary-Kate Hayward et al. Comput Struct Biotechnol J. .

Abstract

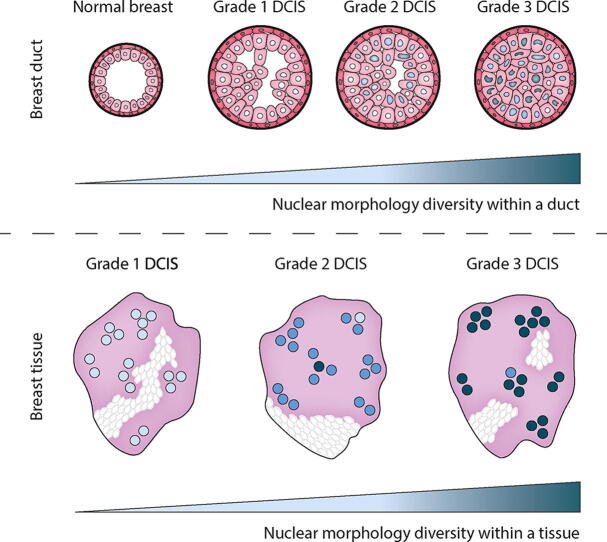
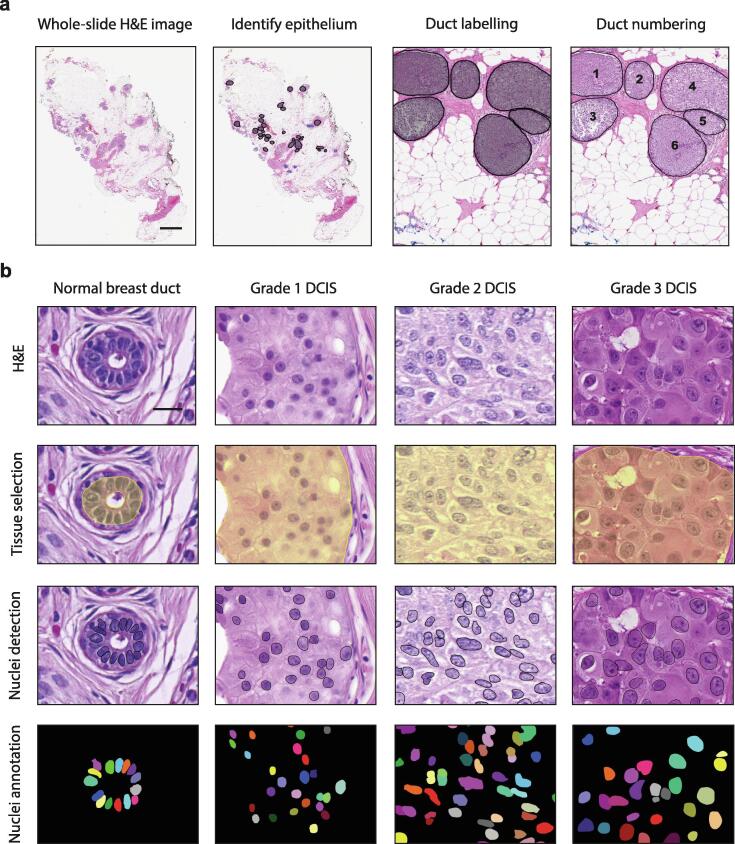
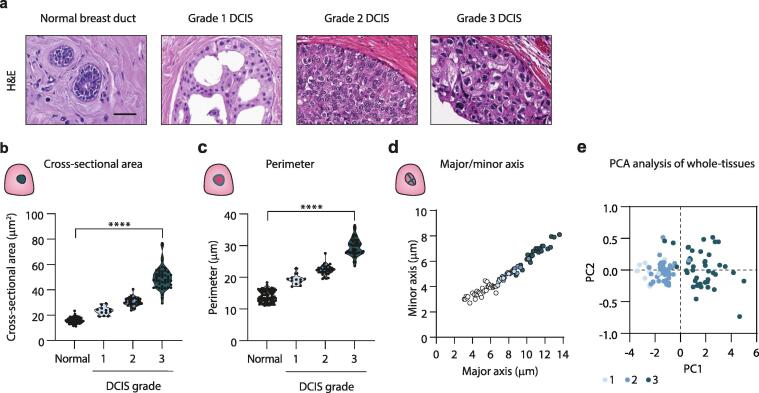
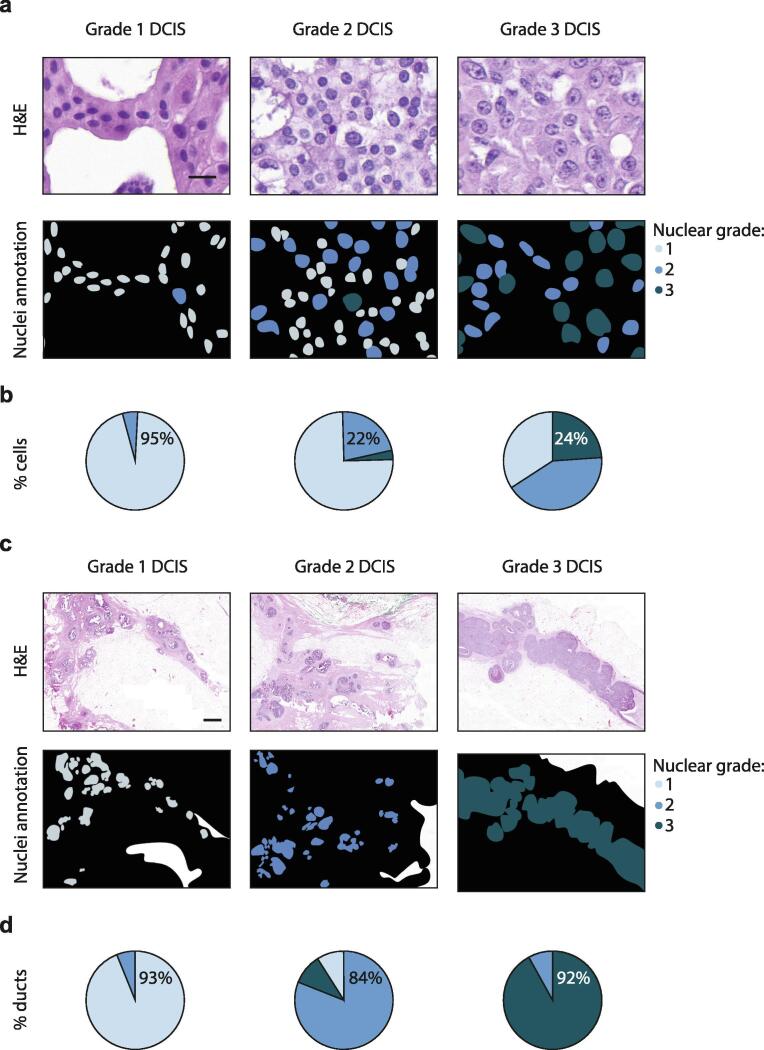
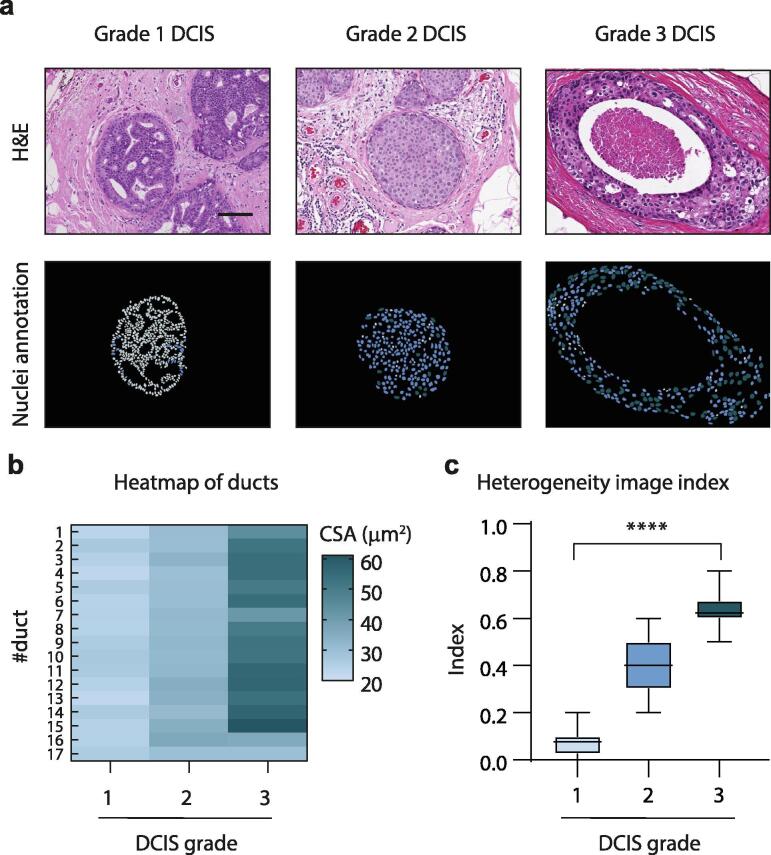
Abnormalities in cell nuclear morphology are a hallmark of cancer. Histological assessment of cell nuclear morphology is frequently used by pathologists to grade ductal carcinoma in situ (DCIS). Objective methods that allow standardization and reproducibility of cell nuclear morphology assessment have potential to improve the criteria needed to predict DCIS progression and recurrence. Aggressive cancers are highly heterogeneous. We asked whether cell nuclear morphology heterogeneity could be incorporated into a metric to classify DCIS. We developed a nuclear heterogeneity image index to objectively, and quantitatively grade DCIS. A whole-tissue cell nuclear morphological analysis, that classified tumors by the worst ten percent in a duct-by-duct manner, identified nuclear size ranges associated with each DCIS grade. Digital image analysis further revealed increasing heterogeneity within ducts or between ducts in tissues of worsening DCIS grade. The findings illustrate how digital image analysis comprises a supplemental tool for pathologists to objectively classify DCIS and in the future, may provide a method to predict patient outcome through analysis of nuclear heterogeneity.

Keywords: Breast cancer; Heterogeneity; Image analysis; Nuclear morphology; Pathology.


Conflict of interest statement

The authors declare that they have no known competing financial interests or personal relationships that could have appeared to influence the work reported in this paper.

Figures

None
Graphical abstract
Fig. 1
Fig. 1
Image analysis workflow for nuclear morphology in DCIS tissues. a, Hematoxylin and eosin (H&E)-stained whole slide image (WSI) of a representative DCIS tissue. Within each tissue, all ducts were identified and numbered as either; normal (blue) or DCIS (black). Scale bar, 2 mm. b, For each individual duct, epithelium was manually selected, nuclei were segmented by automated-detection and nuclear features were extracted using QuPath. Segmented images of nuclei were compared to manually annotated images. Scale bar, 20 µm. (For interpretation of the references to colour in this figure legend, the reader is referred to the web version of this article.)
Fig. 2
Fig. 2
Nuclear morphological features of normal and DCIS epithelial cells. a, H&E staining of a representative normal duct, and DCIS ducts from a DCIS tissue pathologically defined as grade 1–3. Scale bar, 20 µm. b-c, Violin plots of whole-tissue averages of cross-sectional area (b) and perimeter (c) of normal and DCIS cell nuclei. Each dot represents a tissue. d, Dot plot of whole-tissue averages of major and minor axis of normal and DCIS cell nuclei. Each dot represents a tissue. e, PCA analysis comparing nuclear features of DCIS with grade. Grade 1 (light blue), 2 (medium blue), and 3 (dark blue). For plots quantifying nuclear features, normal nuclear averages from each tissue are grouped (n = 90), while DCIS nuclear averages from each tissue are grouped by pathological grade. All plots represent grade 1, n = 12; 2, n = 34; 3, n = 44. All violin plots have a p-value of < 0.0001. (For interpretation of the references to colour in this figure legend, the reader is referred to the web version of this article.)
Fig. 3
Fig. 3
Quantitative grading of DCIS using nuclear morphological features. a, Annotations categorizing each DCIS cell within a tissue to a nuclear grade based on their cross-sectional area from a H&E image. Scale bar, 20 µm. b, Average number of cells belonging to grade 1–3 within a DCIS tissue grouped by pathological grade. c, Annotations categorizing each DCIS duct within a tissue to a nuclear grade based on the worst 10% of cells according to their cross-sectional area from a H&E image. Scale bar, 1 mm. d, Average number of ducts belonging to grade 1–3 within a DCIS tissue grouped by pathological grade. For all annotations, grade 1 (light blue), 2 (medium blue), and 3 (dark blue). All plots represent grade 1, n = 12; 2, n = 34; 3, n = 44. (For interpretation of the references to colour in this figure legend, the reader is referred to the web version of this article.)
Fig. 4
Fig. 4
Quantifying heterogeneity within and between DCIS ducts of single tissues. a, Annotations categorizing each DCIS cell within a duct based on their cross-sectional area from a H&E image. Scale bar, 100 µm. b, Heat map analysis of DCIS duct averages of cross-sectional area (CSA) of nuclei. A single tissue with a matched-number of DCIS ducts from each pathological grade 1–3 was used for this analysis. c, Box plot analysis of the heterogeneity image index. Each dot represents a tissue, and tissues are grouped by pathological grade (grade 1, n = 12; 2, n = 34; 3, n = 44). Box plot has a p-value of < 0.0001. For all annotations, grade 1 (light blue), 2 (medium blue), and 3 (dark blue). (For interpretation of the references to colour in this figure legend, the reader is referred to the web version of this article.)

References

    1. Uhler C., Shivashankar G.V. Nuclear mechanopathology and cancer diagnosis. Trends Cancer. 2018;4(4):320–331. doi: 10.1016/j.trecan.2018.02.009. - DOI - PubMed
    1. Lester S.C. Protocol for the examination of specimens from patients with ductal carcinoma in situ of the breast. Arch Pathol Lab Med. 2009;133(1):15–25. - PubMed
    1. Sanders M.E., Schuyler P.A., Dupont W.D., Page D.L. The natural history of low-grade ductal carcinoma in situ of the breast in women treated by biopsy only revealed over 30 years of long-term follow-up. Cancer. 2005;103(12):2481–2484. doi: 10.1002/cncr.21069. - DOI - PubMed
    1. Collins L.C., Tamimi R.M., Baer H.J., Connolly J.L., Colditz G.A., Schnitt S.J. Outcome of patients with ductal carcinoma in situ untreated after diagnostic biopsy: results from the Nurses' Health Study. Cancer. 2005;103(9):1778–1784. doi: 10.1002/cncr.20979. - DOI - PubMed
    1. Badve S., A'hern R.P., Ward A.M., Millis R.R., Pinder S.E., Ellis I.O., Gusterson B.A., Sloane J.P. Prediction of local recurrence of ductal carcinoma in situ of the breast using five histological classifications: a comparative study with long follow-up. Hum Pathol. 1998;29(9):915–923. doi: 10.1016/S0046-8177(98)90196-4. - DOI - PubMed