

2D Zernike polynomial expansion: Finding the protein-protein binding regions
- PMID: 33363707
- PMCID: PMC7750141
- DOI: 10.1016/j.csbj.2020.11.051
2D Zernike polynomial expansion: Finding the protein-protein binding regions
Abstract
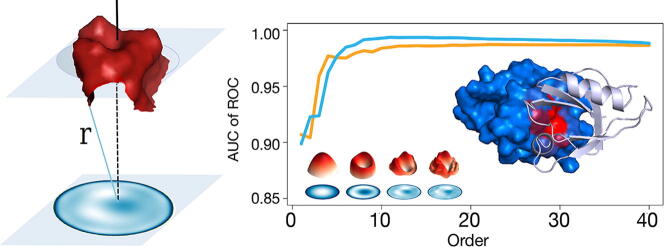
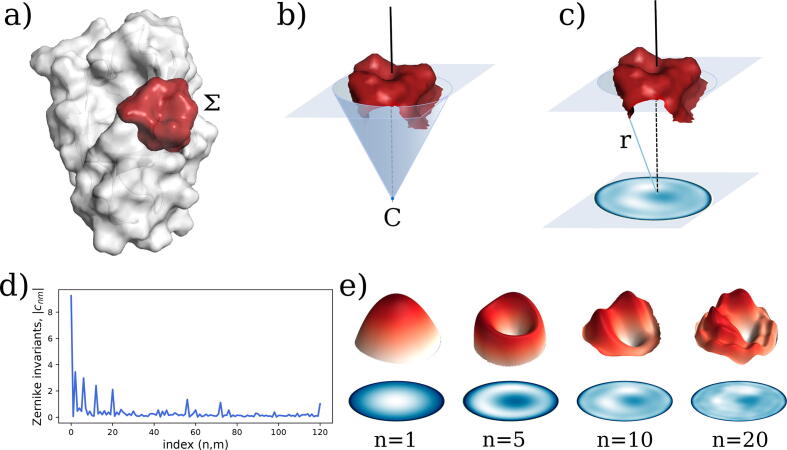
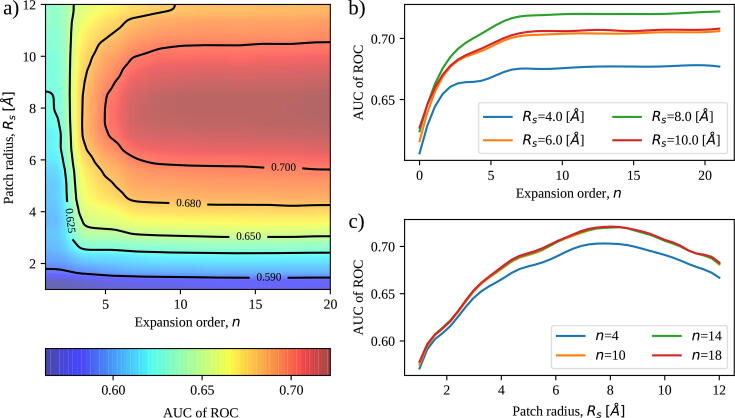
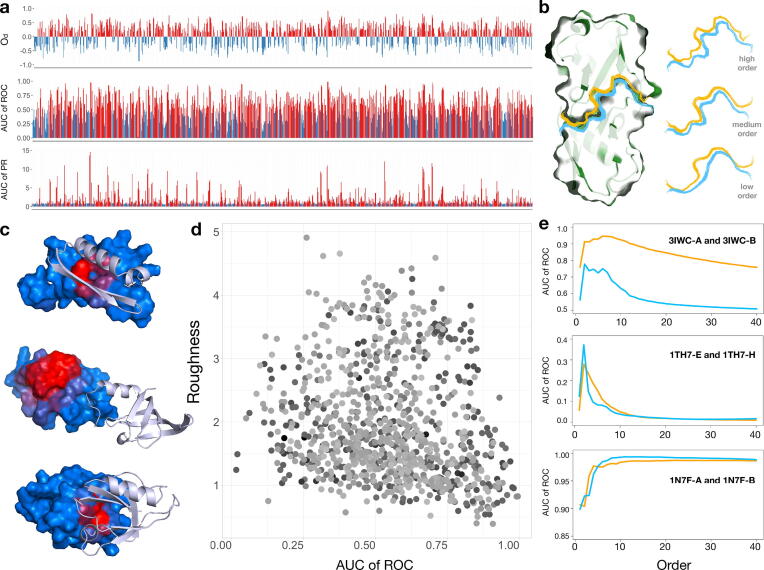
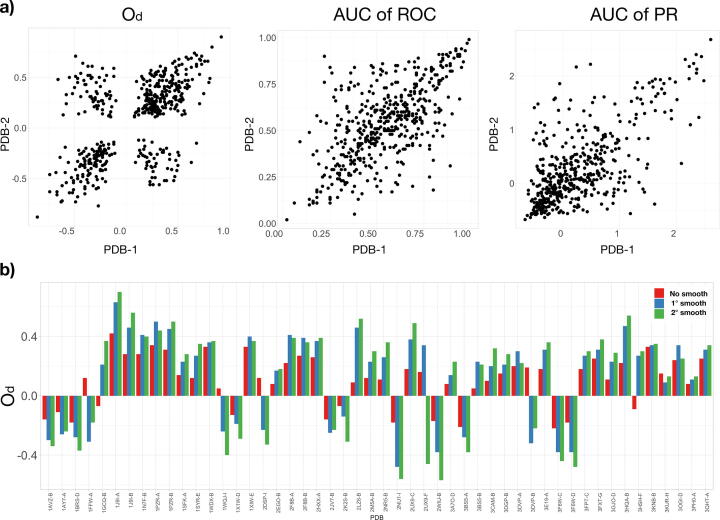
We present a method for efficiently and effectively assessing whether and where two proteins can interact with each other to form a complex. This is still largely an open problem, even for those relatively few cases where the 3D structure of both proteins is known. In fact, even if much of the information about the interaction is encoded in the chemical and geometric features of the structures, the set of possible contact patches and of their relative orientations are too large to be computationally affordable in a reasonable time, thus preventing the compilation of reliable interactome. Our method is able to rapidly and quantitatively measure the geometrical shape complementarity between interacting proteins, comparing their molecular iso-electron density surfaces expanding the surface patches in term of 2D Zernike polynomials. We first test the method against the real binding region of a large dataset of known protein complexes, reaching a success rate of 0.72. We then apply the method for the blind recognition of binding sites, identifying the real region of interaction in about of the analyzed cases. Finally, we investigate how the efficiency in finding the right binding region depends on the surface roughness as a function of the expansion order.
Keywords: Molecular surface; Protein-protein interactions; Shape complementarity.
© 2020 Published by Elsevier B.V. on behalf of Research Network of Computational and Structural Biotechnology.
Conflict of interest statement
The authors declare that the research was conducted in the absence of any commercial or financial relationships that could be construed as a potential conflict of interest.
Figures
References
-
- Valencia A., Pazos F. Computational methods for the prediction of protein interactions. Current Opinion Struct Biol. 2002;12(3):368–373. - PubMed
-
- Skrabanek L., Saini H.K., Bader G.D., Enright A.J. Computational prediction of protein-protein interactions. Mol Biotechnol. 2008;38(1):1–17. - PubMed
-
- Han J.-D.J., Bertin N., Hao T., Goldberg D.S., Berriz G.F., Zhang L.V., Dupuy D., Walhout A.J., Cusick M.E., Roth F.P. Evidence for dynamically organized modularity in the yeast protein-protein interaction network. Nature. 2004;430(6995):88–93. - PubMed
-
- Berggård T., Linse S., James P. Methods for the detection and analysis of protein-protein interactions. Proteomics. 2007;7(16):2833–2842. - PubMed
LinkOut - more resources
Full Text Sources
Other Literature Sources