. 2020 Aug 14:28:111-125.
doi: 10.1016/j.jare.2020.08.008. eCollection 2021 Feb.

Static internal representation of dynamic situations reveals time compaction in human cognition

Affiliations

Static internal representation of dynamic situations reveals time compaction in human cognition

José Antonio Villacorta-Atienza et al. J Adv Res. .

Abstract

Introduction: The human brain has evolved under the constraint of survival in complex dynamic situations. It makes fast and reliable decisions based on internal representations of the environment. Whereas neural mechanisms involved in the internal representation of space are becoming known, entire spatiotemporal cognition remains a challenge. Growing experimental evidence suggests that brain mechanisms devoted to spatial cognition may also participate in spatiotemporal information processing.

Objectives: The time compaction hypothesis postulates that the brain represents both static and dynamic situations as purely static maps. Such an internal reduction of the external complexity allows humans to process time-changing situations in real-time efficiently. According to time compaction, there may be a deep inner similarity between the representation of conventional static and dynamic visual stimuli. Here, we test the hypothesis and report the first experimental evidence of time compaction in humans.

Methods: We engaged human subjects in a discrimination-learning task consisting in the classification of static and dynamic visual stimuli. When there was a hidden correspondence between static and dynamic stimuli due to time compaction, the learning performance was expected to be modulated. We studied such a modulation experimentally and by a computational model.

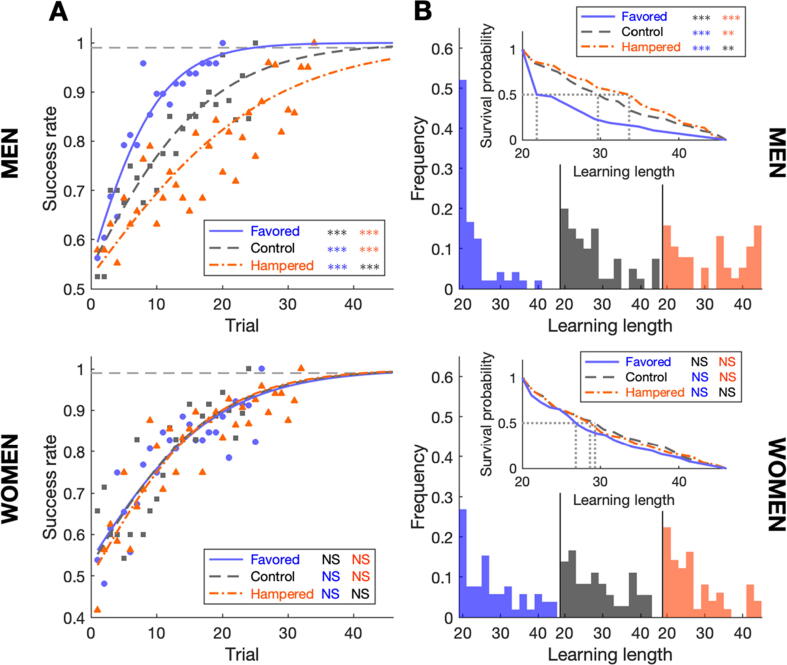
Results: The collected data validated the predicted learning modulation and confirmed that time compaction is a salient cognitive strategy adopted by the human brain to process time-changing situations. Mathematical modelling supported the finding. We also revealed that men are more prone to exploit time compaction in accordance with the context of the hypothesis as a cognitive basis for survival.

Conclusions: The static internal representation of dynamic situations is a human cognitive mechanism involved in decision-making and strategy planning to cope with time-changing environments. The finding opens a new venue to understand how humans efficiently interact with our dynamic world and thrive in nature.

Keywords: Decision making; Dynamic environments; Spatiotemporal cognition; Strategy planning.


Conflict of interest statement

None.

Figures

None
Graphical abstract
Fig. 1
Fig. 1
Hypothesis of time compaction. Left: Example of a dynamic situation. To move safely, the subject (forefront) generates a CIR of the situation. Right: The CIR is formed by predicting the behavior of other parties (green arrows) and simulating the subject’s positions at different times (colored curves for times t1, t2, t3, …, tn). Coincidences between the subject’s virtual positions and the predicted locations of the pedestrians correspond to potential collisions, represented as virtual static obstacles in the CIR (orange areas). Then, the trajectory avoiding virtual obstacles in the CIR (blue arrowed curve) allows safe navigation in the real space (light blue arrowed curve). (For interpretation of the references to colour in this figure legend, the reader is referred to the web version of this article.)
Fig. 2
Fig. 2
From theory to experiments. Time-compacted internal representation in allocentric context. (A) Dynamic stimulus with future interactions is compacted and represented by its CIR (collision area). (B) Dynamic stimuli without collisions are not compacted but represented as spatiotemporal events. (C) Idea of the two-phase experiment. According to the hypothesis, in the brain a compacted dynamic stimulus and a static stimulus resembling its CIR will be closely related. Assume that in phase 1 (left), a subject has learned an association between a specific static stimulus and an arrow key (e.g., the down-arrow key). Then, in phase 2 (right), when the compacted dynamic stimulus is displayed, it will be represented by its CIR, whose resemblance with the static stimulus will elicit the same stimulus-key association, thus the subject will likely press the same arrow key (down-arrow key in the figure). Note that the moving circles are depicted as sequences of light-to-dark circles. Light and dark circles correspond to the initial and final positions of the circles, respectively. Besides, circle separation illustrates their speed: closer/further consecutive circles denote slower/faster movement (see also Supplementary Video).
Fig. 3
Fig. 3
Experimental procedure. (A) Participants go consecutively through phases 1 and 2. In each phase, they discover by trial and error a hidden rule relating the up- and down-arrow keys with the stimuli shown on the screen. In each trial, a participant receives feedback depending on whether the pressed key matches the hidden rule or not. (B) Hidden rule 1 associates the up-and down-arrow keys with the three static stimuli (a green circle located at the middle bottom part of the screen, and a red circle is at the upper part of the screen for the Favored and Hampered groups, and located laterally above the green one for the Control group). For each participant, the arrow key assignment is randomly established at the beginning of the experiment. This rule differs among Favored, Control, and Hampered groups. Note, the green circle does not carry information and is intended as a spatial reference to clearly distinguish center from sides. Hidden rule 2 is the same for all these groups. It associates the up- and down-arrow keys with the six dynamic stimuli, two dynamic matching (DM), and four non-dynamic matching (non-DM) stimuli (all dynamic stimuli show the green circle moving upwards vertically, and the red one displacing upwards diagonally). The static and dynamic matching stimuli (SM and DM) are highlighted in purple. The picture shows one of the two possible assignments of arrow keys; in the other one, the up-arrow key is changed by the down-arrow key and vice versa (dynamic stimuli are represented by sequences of light-to-dark circles as in Fig. 2, see also Supplementary Video). (For interpretation of the references to colour in this figure legend, the reader is referred to the web version of this article.)
Fig. 4
Fig. 4
Modulation of learning performance in phase 2. Top and bottom rows correspond to men and women, respectively; blue, black, and orange colors stand for Favored (F), Control (C), and Hampered (H) groups respectively (F: 48 men, 52 women; C: 40 men, 35 women; H: 38 men, 48 women). (A) Population learning process as success rate per trial (considered up to 0.99 level, dashed lines). Men in Favored/Hampered group learned the testing association rule faster/slower than men in Control group (F vs. C: p = 3e−04; F vs. H: p = 9.8e−13; C vs. H: p = 2.5e−04). Population learning process in women showed no dependence on the direction of conditioning (F vs. C: p = 0.43; F vs. H: p = 0.28; C vs. H: p = 0.93). Men from the Control group and women from all groups showed no significant differences (p = 0.23, n = 40 vs. 135). Curves describe the logistic regression of the corresponding population learning (circles, squares, and triangles correspond to Favored, Control, and Hampered groups respectively). (B) Individual learning performance. The histograms show the distributions of the learning length (from left to right: Favored, Control, and Hampered). It is significantly more/less likely for men in Favored/Hampered groups to learn the association rule than in Control condition (F vs. C: p = 7.2e−04; F vs. H: p = 3.5e−8; C vs. H: p = 5.8e−03). This effect was not observed in women (F vs. C: p = 0.98; F vs. H: p = 0.67; C vs. H: p = 0.76). Men from the Control group and women from all groups did not show significant differences (p = 0.95, n = 40 vs. 135). Insets show Cox survival curves quantifying differences in the individual learning performance. Dotted lines mark the learning length for the learning probability of 0.5. (For interpretation of the references to colour in this figure legend, the reader is referred to the web version of this article.)
Fig. 5
Fig. 5
Salience of time compaction within phase 2. (A) Typical sequence of six dynamic stimuli (two DMs and four non-DMs) in phase 2. The distances between successive appearances of e.g., stimulus DM2 influence its learning. (B) Population probability of answering successfully at the next appearance of DM stimulus for different groups of subjects at trial 5 (left, beginning of learning), 13 (middle, the intermediate stage of learning), and 20 (right, the final stage of learning). Insets show the frequency of N repetitions of the stimuli in a sequence as in (A). Solid and dashed colored curves depict the success probability fitted by logistic regression (GLM, logit link). The repetition distance and trial association differ significantly between experimental groups for men (between distance, trial and group p = 5e−4; pairwise distance and trial for Favored group p = 1e−4, for Control Group p = 0.028 and for Hampered group p = 1e−3) but not for women (between distance, trial and group p = 0.08; pairwise distance and trial for Favored group p = 0.06, for Control Group p = 0.54 and for Hampered group p = 0.92). (For interpretation of the references to colour in this figure legend, the reader is referred to the web version of this article.)
Fig. 6
Fig. 6
Rule verbalization and response time (top and bottom rows correspond to men and women, respectively). (A) Rule verbalization in terms of ‘collision’ has a probability above 0.7 for men who quickly learned the rule regardless of the experimental group. The probability decreases with the learning length. No correlation is observed for women (thick curves and grey areas denote logistic regression and confidence intervals at 95%, respectively; men: p = 1.2e−3, n = 126; women: p = 0.67, n = 135). (B) Response time shows no differences among groups (GEE with linear link function, F vs. C: p = 0.13, n = 100 vs. 75; F vs. H: p = 0.45, n = 100 vs. 86; C vs. H: p = 0.42, n = 86 vs. 75) and for gender (p = 0.4, n = 126 men vs. 135 women). ***: < 0.001; **: < 0.01; *: < 0.05; NS: No significant difference.
Fig. 7
Fig. 7
Probabilistic modeling of time compaction. Main panels: Histogram and stair-like curve correspond to experimental and simulated individual learning performance, respectively (Favored in blue, Control in black, and Hampered in orange). Insets: Population learning process. Different markers correspond to experimental data, while curves show the model predictions, i.e., the successful answer probabilities P(T,γ). (For interpretation of the references to colour in this figure legend, the reader is referred to the web version of this article.)
Fig. 8
Fig. 8
Exploration of alternative hypotheses. (A) Statistical tests of the influence of arrow keys (down and up) on the learning length in different groups of subjects. All associations are not significant (between gender, experimental group, and arrow key p = 0.17; pairwise interactions gender and arrow key: p = 0.91 for men, p = 0.29 for women; group and arrow key: p = 0.23 for Favored, p = 0.34 for Control, and p = 0.76 for Hampered). (B) Learning in phase 2 without previous exposure to phase 1. No significant differences between women (green) and men (purple) were found in population (left, p = 0.59) and individual (right, p = 0.48) learning performances. (For interpretation of the references to colour in this figure legend, the reader is referred to the web version of this article.)

Similar articles

Cited by

References

    1. Eichenbaum H., Fortin N. Episodic memory and the hippocampus: It’s about time. Curr Dir Psichol Sci. 2003;12(2):53–57.
    1. Llinás R.R. MIT Press; 2001. I of the Vortex: From neurons to self.
    1. Rao S., Mayer A., Harrington D. The evolution of brain activation during temporal processing. Nat Neurosci. 2001;4:317–323. - PubMed
    1. Livesey A.C., Wall M.B., Smith A.T. Time perception: manipulation of task difficulty dissociates clock functions from other cognitive demands. Neuropsychologia. 2007;45:321–331. - PubMed
    1. Kraus B.J., Robinson R.J., White J.A., Eichenbaum H., Hasselmo M.E. Hippocampal “time cells”: time versus path integration. Neuron. 2013;78:1090–1101. - PMC - PubMed

LinkOut - more resources