. 2020 Jun 24:28:255-267.
doi: 10.1016/j.jare.2020.06.020. eCollection 2021 Feb.

Quercitrin alleviates cartilage extracellular matrix degradation and delays ACLT rat osteoarthritis development: An in vivo and in vitro study

Affiliations

Quercitrin alleviates cartilage extracellular matrix degradation and delays ACLT rat osteoarthritis development: An in vivo and in vitro study

Hanli Guo et al. J Adv Res. .

Abstract

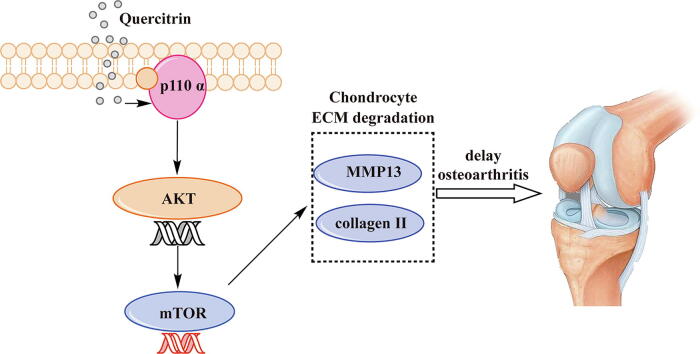
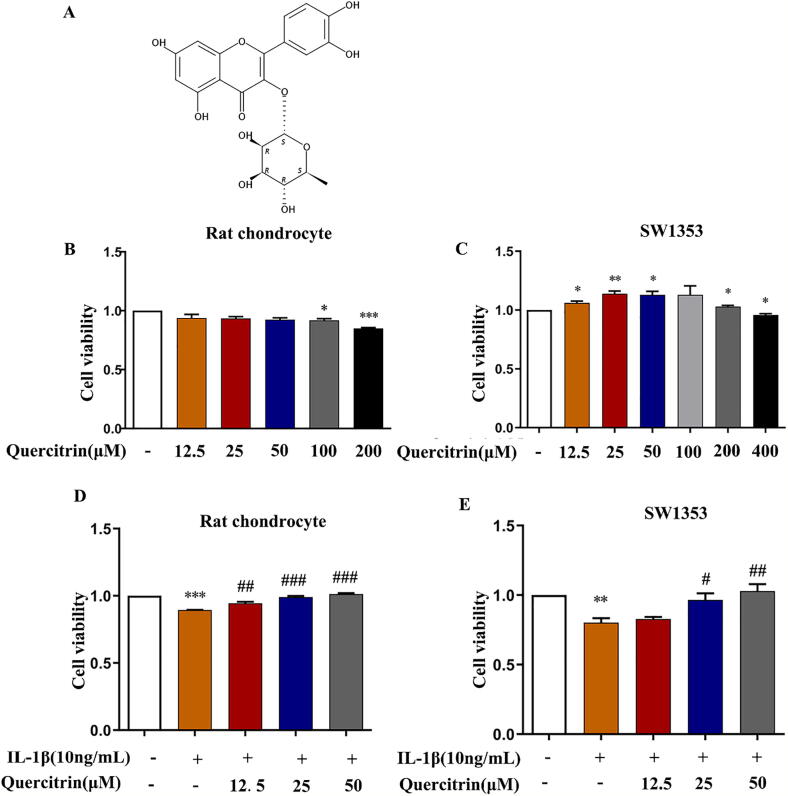
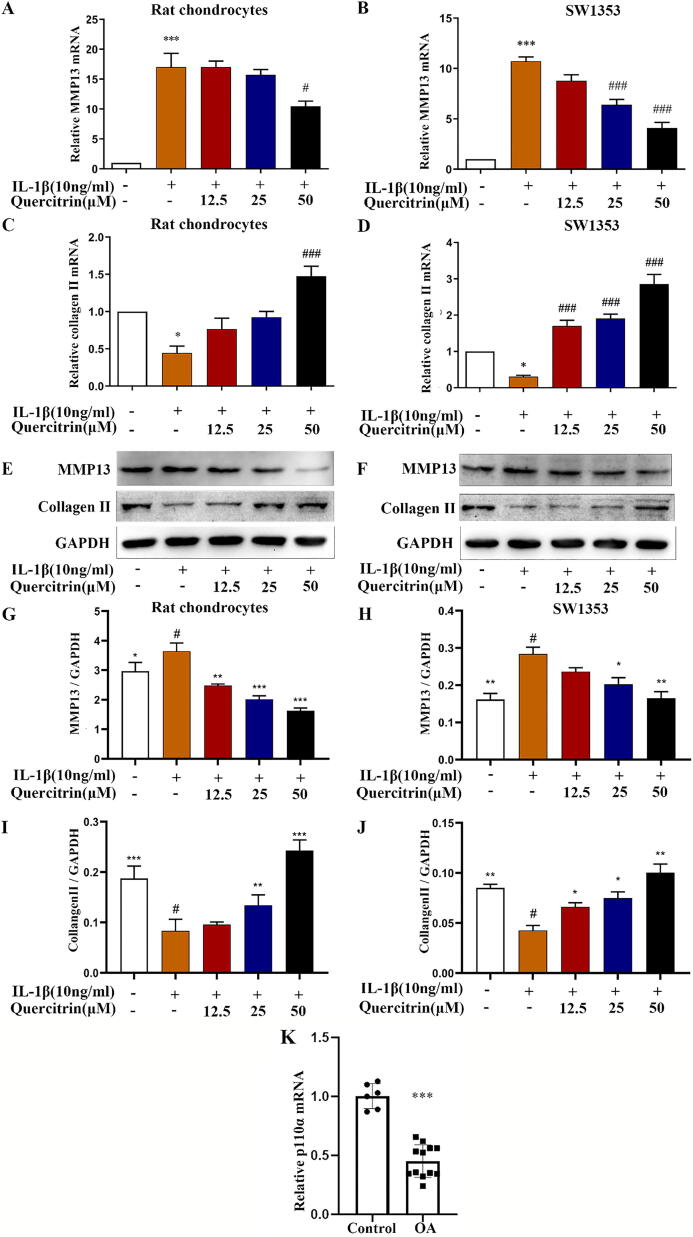
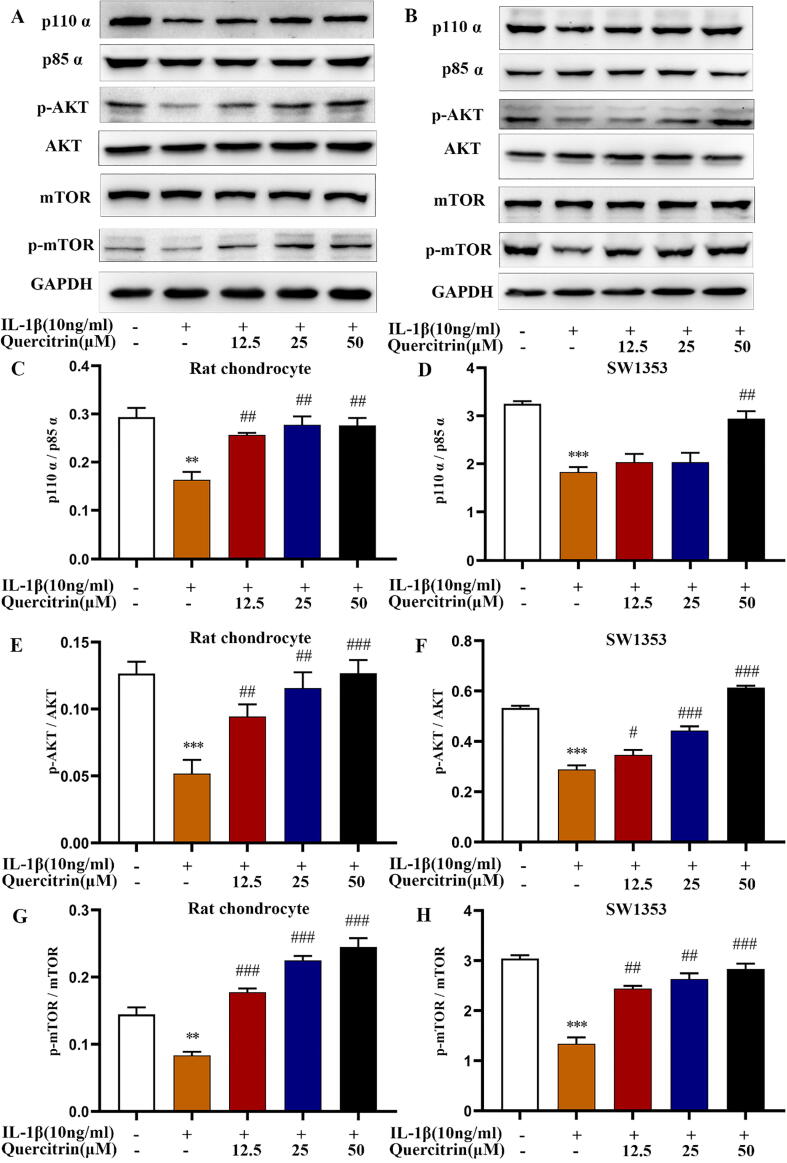
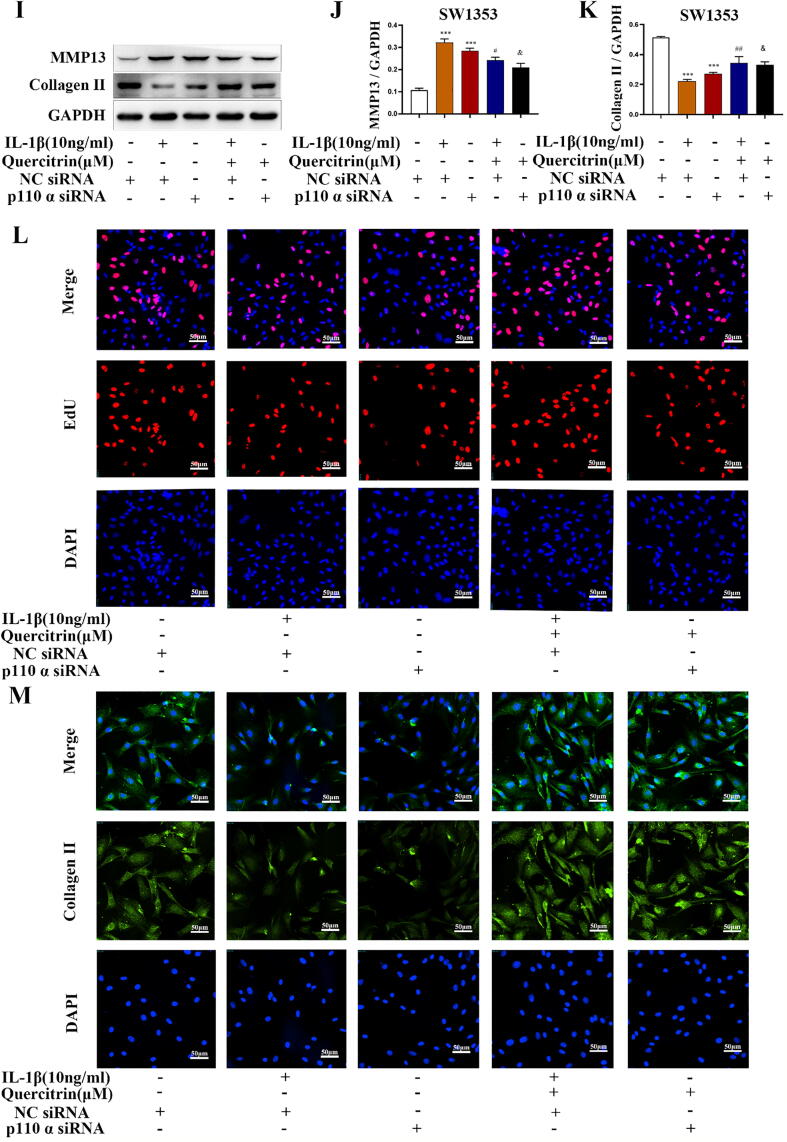
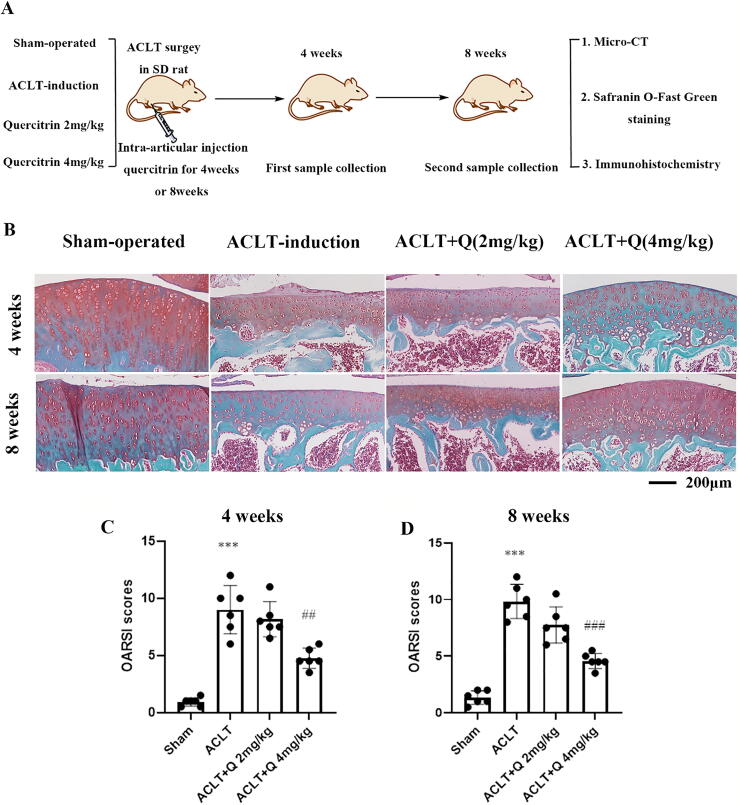
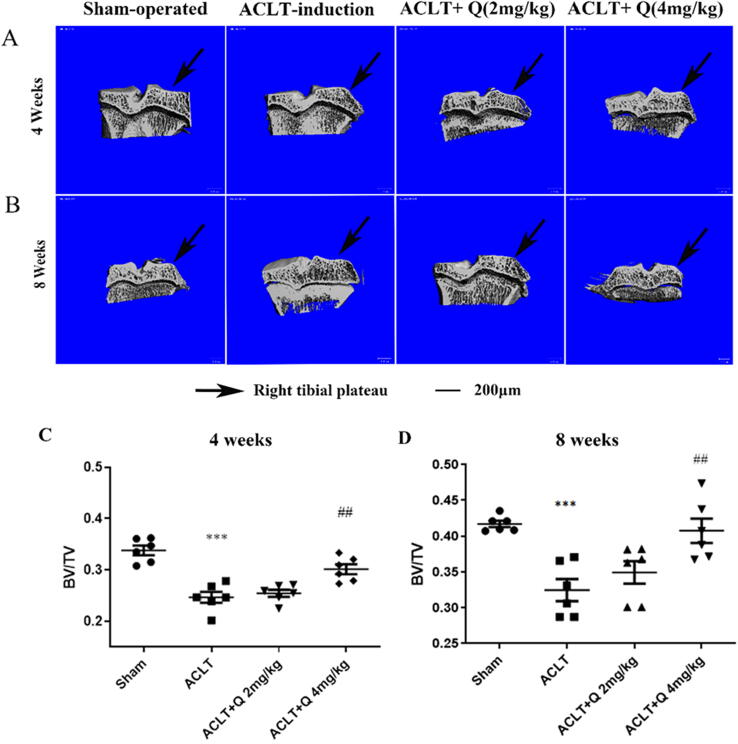
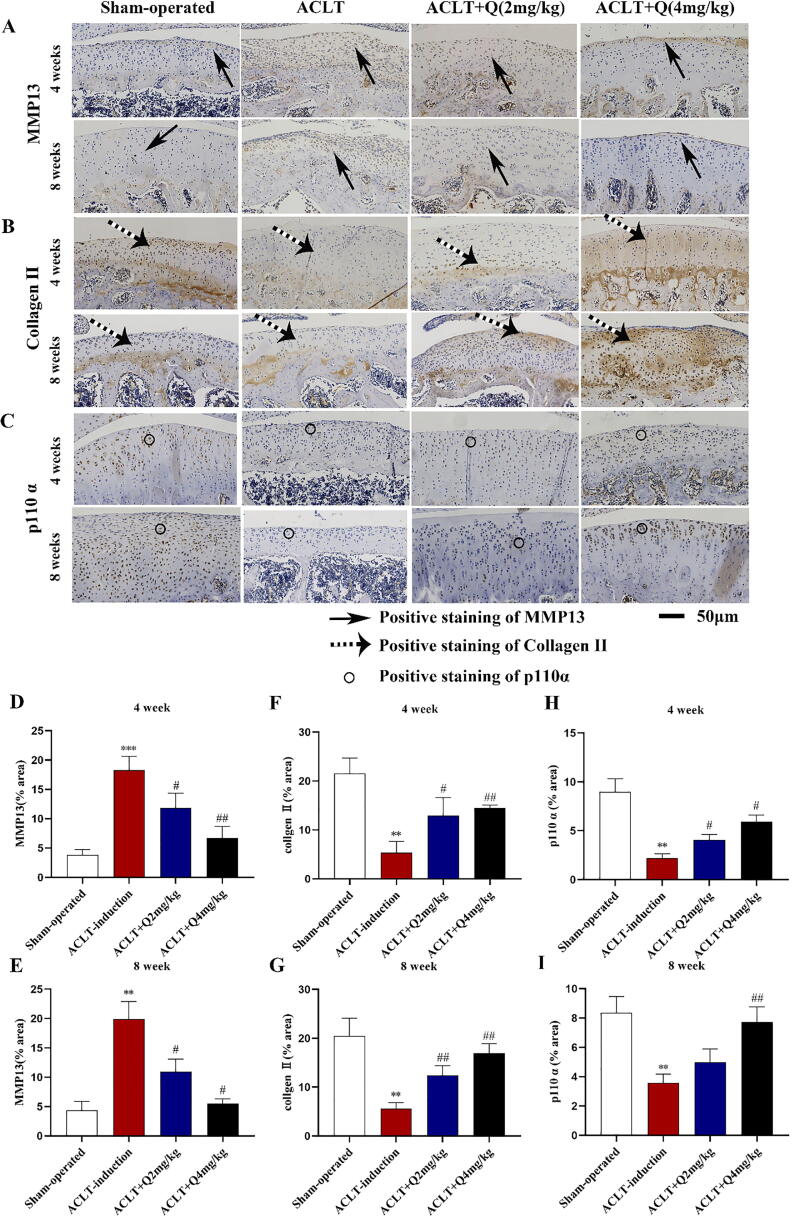
Introduction: Disruptions of extracellular matrix (ECM) degradation homeostasis play a significant role in the pathogenesis of osteoarthritis (OA). Matrix metalloproteinase 13 (MMP13) and collagen Ⅱ are important components of ECM. Earlier we found that quercitrin could significantly decrease MMP13 gene expression and increase collagen Ⅱ gene expression in IL-1β-induced rat chondrocytes and human chondrosarcoma (SW1353) cells. Objectives: The effects and mechanism of quercitrin on OA were explored. Methods: Molecular mechanisms of quercitrin on OA were studied in vitro in primary chondrocytes and SW1353 cells. An anterior cruciate ligament transection (ACLT) rat model of OA was used to investigate the effect of quercitrin in vivo. Micro-CT analysis and Safranin O-Fast Green Staining of knee joint samples were performed to observe the damage degree of tibial subchondral bone. Immunohistochemistry of knee joint samples were conducted to observe the protein level of MMP13, collagen Ⅱ and p110α in articular cartilage. Results: In vitro, quercitrin promoted cell proliferation and delayed ECM degradation by regulating MMP13 and collagen II gene and protein expressions. Moreover, quercitrin activated the Phosphatidylinositol 3-kinase p110α (p110α)/AKT/mTOR signaling pathway by targeting p110α. We also firstly showed that the gene expression level of p110α was remarkably decreased in cartilage of OA patients. The results showed that intra-articular injection of quercitrin increased bone volume/tissue volume of tibial subchondral bone and cartilage thickness and reduced the Osteoarthritis Research Society International scores in OA rats. Meanwhile, immunohistochemical results showed that quercitrin exerted anti-OA effect by delaying ECM degradation. Conclusion: These findings suggested that quercitrin may be a prospective disease-modifying OA drug for prevention and treatment of early stage OA.

Keywords: ACLT, anterior cruciate ligament transection; BV/TV, bone volume/tissue volume; DMOAD, disease-modifying OA drug; ECM, extracellular matrix; Extracellular matrix degradation; MMP13; MMP13, matrix metalloproteinase 13; NSAIDs, non-steroidal anti-inflammatory drugs; OA, osteoarthritis; OARSI, Osteoarthritis Research Society International; Osteoarthritis; PI3K, Phosphatidylinositol 3-kinase; Phosphatidylinositol 3-kinase p110α; Quercitrin; p110α, Phosphatidylinositol 3-kinase p110α.


Conflict of interest statement

The authors declare that they have no known competing financial interests or personal relationships that could have appeared to influence the work reported in this paper.

Figures

None
Graphical abstract
Fig. 1
Fig. 1
The cytotoxic effects of quercitrin on chondrocytes. (A) Chemical structure of quercitrin C21H20O11. (B–C) The cell viability of rat chondrocytes and SW1353 cells that were treated with different concentrations of quercitrin for 48 h as detected by CCK8 assay. (D-E) Rat chondrocytes and SW1353 cells were pretreated with IL-1β (10 ng/ml) for 2 h prior to treatment with different concentrations of quercitrin (12.5, 25, and 50 μM) for 48 h. The cell viability was measured by CCK8 assay. All experiments were repeated at least three times with similar results. All data are represented as the mean ± SD. Viability (CCK8) results were assessed by a one-way ANOVA, followed by Tukey's range test. *P < 0.05, **P < 0.01 and ***P < 0.001 versus the control group; #P < 0.05, ##P < 0.01 and ###P < 0.001 versus the IL-1β-treated group.
Fig. 2
Fig. 2
Quercitrin suppressed MMP13 expression and increased collagen Ⅱ deposition in IL-1β-induced rat chondrocytes and SW1353 cells. (A–D) Rat chondrocytes and SW1353 cells were pretreated with IL-1β (10 ng/ml) for 2 h prior to treatment with different concentrations of quercitrin (12.5, 25, and 50 μM) for 48 h. The cells were collected and collagen II and MMP13 mRNA expression levels were evaluated by RT-PCR. (E-J) Rat chondrocytes and SW1353 cells were pre-treated with IL-1β (10 ng/ml) for 2 h prior to treatment with different concentrations of quercitrin (12.5, 25, and 50 μM) for 48 h. The cells were collected and collagen II and MMP13 protein expression levels were evaluated by western blot. RT-PCR and western blot were repeated at least three times with similar results. All data are represented as the mean ± SD. *P < 0.05, **P < 0.01and ***P < 0.001 versus the control group; #P < 0.05, ##P < 0.01 and ###P < 0.001 versus the IL-1β-treated group. (K) Compared with control (n = 6), p110α mRNA expression levels were significantly decreased in severe OA patients (n = 12) by RT-PCR. ***P < 0.001 versus the control. Data from RT-PCR and western blot were analyzed by using one-way ANOVA, followed by Tukey's range test.
Fig. 3
Fig. 3
Quercitrin activated the p110α/AKT/mTOR signaling pathway by targeting p110α. (A–H) Rat chondrocytes and SW1353 cells were pretreated with IL-1β (10 ng/ml) for 2 h prior to treatment with different concentrations of quercitrin (12.5, 25, and 50 μM) for 48 h. The p110α, p85α, p-AKT, t-AKT, p-mTOR, and t-mTOR protein expression levels were evaluated by western blot. All data are represented as mean ± SD. *P < 0.05, **P < 0.01 and ***P < 0.001 versus the control group; #P < 0.05, ##P < 0.01 and ###P < 0.001 versus the IL-1β treated group. (I-K) NC and p110α siRNAs transfected into SW1353 cells. Twelve hours after transfection, the cells were IL-1β and quercitrin for 48 h, after which the cells were used for the following experiments. MMP13 and collagen Ⅱ protein expression were evaluated by western blot. All data are represented as the mean ± SD. ***P < 0.001 versus the control group; #P < 0.05 and ##P < 0.01 versus the IL-1β treated group; &P < 0.05 versus the IL-1β and quercitrin treated group. (L) Collagen Ⅱ was evaluated by immunofluorescence. (M) EdU staining experiments are used to observe red proliferating cells. All experiments were repeated at least three times with similar results. Data from RT-PCR and western blot were analyzed by using one-way ANOVA, followed by Tukey's range test. (For interpretation of the references to colour in this figure legend, the reader is referred to the web version of this article.)
Fig. 3
Fig. 3
Quercitrin activated the p110α/AKT/mTOR signaling pathway by targeting p110α. (A–H) Rat chondrocytes and SW1353 cells were pretreated with IL-1β (10 ng/ml) for 2 h prior to treatment with different concentrations of quercitrin (12.5, 25, and 50 μM) for 48 h. The p110α, p85α, p-AKT, t-AKT, p-mTOR, and t-mTOR protein expression levels were evaluated by western blot. All data are represented as mean ± SD. *P < 0.05, **P < 0.01 and ***P < 0.001 versus the control group; #P < 0.05, ##P < 0.01 and ###P < 0.001 versus the IL-1β treated group. (I-K) NC and p110α siRNAs transfected into SW1353 cells. Twelve hours after transfection, the cells were IL-1β and quercitrin for 48 h, after which the cells were used for the following experiments. MMP13 and collagen Ⅱ protein expression were evaluated by western blot. All data are represented as the mean ± SD. ***P < 0.001 versus the control group; #P < 0.05 and ##P < 0.01 versus the IL-1β treated group; &P < 0.05 versus the IL-1β and quercitrin treated group. (L) Collagen Ⅱ was evaluated by immunofluorescence. (M) EdU staining experiments are used to observe red proliferating cells. All experiments were repeated at least three times with similar results. Data from RT-PCR and western blot were analyzed by using one-way ANOVA, followed by Tukey's range test. (For interpretation of the references to colour in this figure legend, the reader is referred to the web version of this article.)
Fig. 4
Fig. 4
Quercitrin attenuated cartilage degradation in ACLT rats. (A) Animal flow chart of quercitrin against OA. (B) Safranin O-Fast Green Staining of knee samples was performed at 4 and 8 weeks after ACLT surgery. (C–D) OARSI scores of articular cartilage at 4 and 8 weeks after ACLT surgery. All data are represented as mean ± SD. ***P < 0.001 versus the sham-operated group. ##P < 0.01 versus the ACLT-induction group. Data from OARSI scores were analyzed by using one-way ANOVA, followed by Tukey's range test (n = 6 for each group). (For interpretation of the references to colour in this figure legend, the reader is referred to the web version of this article.)
Fig. 5
Fig. 5
Micro-CT analysis of quercitrin effects on the tibia after DMM surgery. (A) Micro-CT 3D reconstructions of tibial subchondral bones in ACLT rat knee joints were performed at 4 weeks after ACLT surgery. (B) Micro-CT 3D reconstructions of tibial subchondral bones in ACLT rat knee joints were performed at 8 weeks after ACLT surgery. (C-D) BV/TV were measured in the subchondral bone of rats at 4 and 8 weeks after ACLT surgery (n = 6 per group). All data are represented as the mean ± SD. ***P < 0.001, versus the sham-operated group. ##P < 0.01 versus the ACLT-induction group. Data from BV/TV were analyzed by using one-way ANOVA, followed by Tukey's range test.
Fig. 6
Fig. 6
Intra-articular injections of quercitrin in ACLT rats attenuate ECM degradation. (A) Paraffin wax sections were used to detect MMP13 expression with immunohistochemistry at 4 and 8 weeks after ACLT surgery. Solid arrows indicate positive staining for MMP13. (B) Paraffin wax sections were used to detect collagen II expression with immunohistochemistry at 4 and 8 weeks after ACLT surgery. Dotted arrows indicate positive staining for collagen II. (C) Paraffin wax sections were used to detect p110α expression with immunohistochemistry at 4 and 8 weeks after ACLT surgery. Circle indicate positive staining for p110α. (D) Quantitative analysis of the immunohistochemical staining of MMP 13 at 4 weeks. (E) Quantitative analysis of the immunohistochemical staining of MMP 13 at 8 weeks. (F) Quantitative analysis of the immunohistochemical staining of collagen Ⅱ at 4 weeks. (G) Quantitative analysis of the immunohistochemical staining of collagen Ⅱ at 8 weeks. (H) Quantitative analysis of the immunohistochemical staining of p110 α at 4 weeks. (I) Quantitative analysis of the immunohistochemical staining of p110 α at 8 weeks. All data are represented as the mean ± SD. *P < 0.05, **P < 0.01, ***P < 0.001 and versus sham-operated. #P < 0.05, ##P < 0.01 and ###P < 0.001 versus ACLT-induction. Data from immunohistochemistry experiments were analyzed by using one-way ANOVA, followed by Tukey's range test.

Similar articles

Cited by

References

    1. Karsdal M.A., Michaelis M., Ladel C., Siebuhr A.S., Bihlet A.R., Andersen J.R. Disease-modifying treatments for osteoarthritis (Dmoads) of the knee and hip: lessons learned from failures and opportunities for the future. Osteoarthritis Cartilage. 2016;24(12):2013–2021. - PubMed
    1. Lotz M.K., Carames B. Autophagy and cartilage homeostasis mechanisms in joint health, aging and Oa. Nat Rev Rheumatol. 2011;7(10):579–587. - PMC - PubMed
    1. Hunter D.J. Pharmacologic therapy for osteoarthritis–the era of disease modification. Nat Rev Rheumatol. 2011;7(1):13–22. - PubMed
    1. Vos T., Flaxman A.D., Naghavi M., Lozano R., Michaud C., Ezzati M. Years lived with disability (Ylds) for 1160 Sequelae of 289 diseases and injuries 1990–2010: a systematic analysis for the global burden of disease study 2010. The Lancet. 2012;380:2163–2196. - PMC - PubMed
    1. Glyn-Jones S., Palmer A.J.R., Agricola R., Price A.J., Vincent T.L., Weinans H. Osteoarthritis. The Lancet. 2015;386(9991):376–387. - PubMed

LinkOut - more resources