

Correlation of Visual Field With Peripapillary Vessel Density Through Optical Coherence Tomography Angiography in Normal-Tension Glaucoma
- PMID: 33364080
- PMCID: PMC7746955
- DOI: 10.1167/tvst.9.13.26
Correlation of Visual Field With Peripapillary Vessel Density Through Optical Coherence Tomography Angiography in Normal-Tension Glaucoma
Abstract
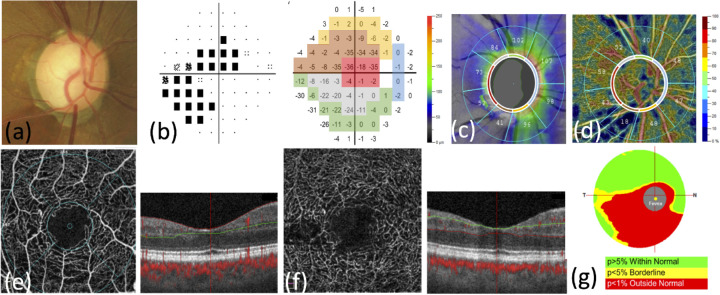
Purpose: To investigate the retinal vessel density (VD) in healthy and normal-tension glaucoma (NTG) eyes through optical coherence tomography angiography (OCTA) and to determine the correlation between VD and the retinal nerve fiber layer (RNFL) thickness and functional visual field (VF) defects for different locations.
Methods: A total of 74 NTG eyes and 24 healthy eyes were included. OCTA VD at 4.5 × 4.5 mm peripapillary region and 3.0 × 3.0 mm macula area, RNFL thickness, and VF pattern deviation results were individually analyzed on the basis of the Garway-Heath sectorization. Correlations between VD and VF/RNFL and VF were compared.
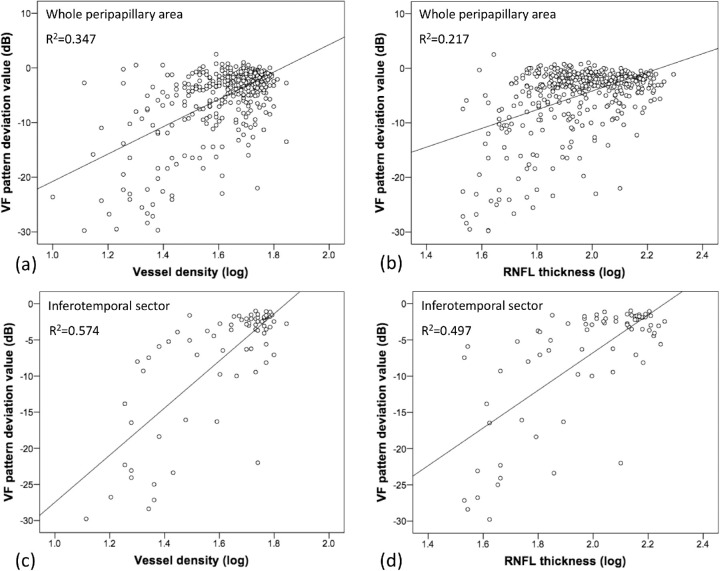
Results: In the NTG group, peripapillary VD, superficial macula VD, RNFL thickness, and ganglion cell complex thickness were significantly lower. In the whole peripapillary area and inferotemporal sector, anatomic correlations between VD and VF pattern deviation values were significantly higher than those between the RNFL thickness and VF values. In the subgroup analysis, VD was anatomically correlated with VF in early-, moderate-, and severe-stage NTG eyes, whereas the RNFL thickness was correlated with VF in moderate- and severe-stage NTG eyes.
Conclusions: We observed VD reduction in the peripapillary retina and superficial macula area in NTG eyes. The microvascular dropout of VD in the peripapillary retina, especially in the inferotemporal sector, provided a more accurate anatomic correlation with functional VF defects than that of the RNFL thickness, especially in early-stage NTG eyes.
Translational relevance: In patients who cannot comply VF exam, VD is a good tool for disease detection.
Keywords: Normal-tension glaucoma; Optical coherence tomography angiography; Vessel density; Visual field defect.
Copyright 2020 The Authors.
Conflict of interest statement
Disclosure: Y.-H. Lin, None; S.-M. Huang, None; L. Yeung, None; W.-C. Ku, None; H.S.-L. Chen, None; C.-C. Lai, None; L.-H. Chuang, None
Figures
Similar articles
-
Optical Coherence Tomography Angiography Analysis of Peripapillary Choroidal Microvascular Density in Normal Tension Glaucoma and Primary Open Angle Glaucoma.J Glaucoma. 2025 Mar 1;34(3):189-197. doi: 10.1097/IJG.0000000000002499. Epub 2024 Sep 25. J Glaucoma. 2025. PMID: 39315934
-
Longitudinal changes in optical coherence tomography angiography characteristics in normal-tension glaucoma with or without high myopia.Acta Ophthalmol. 2024 Aug;102(5):e762-e773. doi: 10.1111/aos.16644. Epub 2024 Jan 26. Acta Ophthalmol. 2024. PMID: 38279584
-
[The function-structure impairment pattern of optic nerves in primary open-angle glaucoma and normal-tension glaucoma].Zhonghua Yan Ke Za Zhi. 2018 Nov 11;54(11):811-819. doi: 10.3760/cma.j.issn.0412-4081.2018.11.004. Zhonghua Yan Ke Za Zhi. 2018. PMID: 30440151 Chinese.
-
The Role of Optical Coherence Tomography Angiography in Glaucoma.Semin Ophthalmol. 2024 Aug;39(6):412-423. doi: 10.1080/08820538.2024.2343049. Epub 2024 Apr 20. Semin Ophthalmol. 2024. PMID: 38643350 Review.
-
HIGHLIGHTS OF HYPERTENSIVE AND NORMOTENSIVE GLAUCOMA.Cesk Slov Oftalmol. 2020 Winter;76(5):222-225. doi: 10.31348/2020/31. Cesk Slov Oftalmol. 2020. PMID: 33499643 Review. English.
Cited by
-
The Topographic Relationship Between Choroidal Microvascular Dropout and Glaucomatous Damage in Primary Angle-Closure Glaucoma.Transl Vis Sci Technol. 2022 Oct 3;11(10):20. doi: 10.1167/tvst.11.10.20. Transl Vis Sci Technol. 2022. PMID: 36239967 Free PMC article.
-
Optical Coherence Tomography Angiography (OCTA) Differences in Vessel Perfusion Density and Flux Index of the Optic Nerve and Peri-Papillary Area in Healthy, Glaucoma Suspect and Glaucomatous Eyes.Clin Ophthalmol. 2023 Oct 12;17:3011-3021. doi: 10.2147/OPTH.S429718. eCollection 2023. Clin Ophthalmol. 2023. PMID: 37850048 Free PMC article.
-
Detection and agreement of event-based OCT and OCTA analysis for glaucoma progression.Eye (Lond). 2024 Apr;38(5):973-979. doi: 10.1038/s41433-023-02817-0. Epub 2023 Nov 11. Eye (Lond). 2024. PMID: 37951976 Free PMC article.
-
Association of contrast sensitivity with vessel density and functional parameters in different stages of glaucoma.Graefes Arch Clin Exp Ophthalmol. 2025 Feb;263(2):477-487. doi: 10.1007/s00417-024-06626-3. Epub 2024 Sep 5. Graefes Arch Clin Exp Ophthalmol. 2025. PMID: 39235500
-
Neuroprotection in Glaucoma: Basic Aspects and Clinical Relevance.J Pers Med. 2022 Nov 10;12(11):1884. doi: 10.3390/jpm12111884. J Pers Med. 2022. PMID: 36579616 Free PMC article. Review.
References
-
- Kaiser HJ, Schoetzau A, Stumpfig D, Flammer J. Blood-flow velocities of the extraocular vessels in patients with high-tension and normal-tension primary open-angle glaucoma. Am J Ophthalmol. 1997; 123: 320–327. - PubMed
-
- Tsai JC. Influencing ocular blood flow in glaucoma patients: the cardiovascular system and healthy lifestyle choices. Can J Ophthalmol. 2008; 43: 347–50. - PubMed
-
- Akagi T, Iida Y, Nakanishi H, et al. .. Microvascular density in glaucomatous eyes with hemifield visual field defects: an optical coherence tomography angiography study. Am J Ophthalmol. 2016; 168: 237–249. - PubMed
Publication types
MeSH terms
LinkOut - more resources
Full Text Sources
