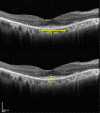
Assessing Residual Cone Function in Retinitis Pigmentosa Patients
- PMID: 33364083
- PMCID: PMC7746956
- DOI: 10.1167/tvst.9.13.29
Assessing Residual Cone Function in Retinitis Pigmentosa Patients
Abstract
Purpose: The purpose of this study was to investigate cone function deterioration in patients with retinitis pigmentosa (RP) using full field electroretinogram (ffERG), pattern electroretinogram (pERG), and optical coherence tomography (OCT) and their correlation with visual acuity (VA).
Methods: Clinical records (2008-2018) of patients with RP undergoing repeat electrophysiology were reviewed. Results of ffERG (30 Hz flicker and fused flicker amplitude [FFAmp]), pERG [p50 and n95], and macular OCT (ellipsoid zone [EZ] and outer segment thickness) were collected.
Results: One hundred twenty-six eyes from 63 patients (33 women, mean age 35 years) were included. The mean decline in VA was 0.11 ± 0.14 logarithm of minimum angle of resolution (logMAR). The FFAmp decreased by 3.01 ± 5.9 µV with global cone function deteriorating by 18.7% annually. The percentage change in FFAmp (RE [r = 0.553], LE [r = 0.531]), and 30 Hz flicker amplitude (RE [r = 0.615], LE [r = 0.529]) strongly correlated with VA (P < 0.00001). The pERG p50 (15 and 30 degrees) change analyzed in 34 patients showed reduction by 23% and 23.4%, respectively. The percentage change in p50 30 degrees (r = 0.397) correlated with VA and EZ layer (P < 0.05). The EZ layer change was calculated in 45 patients and the shortening and thinning rate was 4.3% and 4.4% annually, respectively. The EZ length percentage change correlated with VA (RE [r = 0.34] and LE [r = 0.466; P < 0.05).
Conclusions: We quantified the decline in cone function in patients with RP utilizing ffERG and FFAmp measures of residual cone function. These parameters correlated with VA and OCT when measurable. These objective measures may assist in monitoring disease progression.
Translational relevance: Residual cone function provides an objective estimate of residual visual function, which aids in counselling patients regarding prognosis.
Keywords: OCT; electrophysiology; residual cone function; retinitis pigmenstosa.
Copyright 2020 The Authors.
Conflict of interest statement
Disclosure: T.A. Arsiwalla, None; E.E. Cornish, None; P.V. Nguyen, None; M. Korsakova, None; H. Ali, None; N. Saakova, None; C.L. Fraser, None; R.V. Jamieson, None; J.R. Grigg, Novartis (C)
Figures


References
-
- Hartong DT, Berson EL, Dryja TP. Retinitis pigmentosa. Lancet. 2006; 368: 1795–1809. - PubMed
-
- Audo I, Holder GE, Moore AT. Retinitis pigmentosa and allied disorders. In: Puech B, De Laey JJ, Holder G. Inherited Chorioretinal Dystrophies. Berlin, Heidelberg: Springer;2014.
Publication types
MeSH terms
LinkOut - more resources
Full Text Sources
Research Materials

