. 2020 Dec 4;24(1):101892.
doi: 10.1016/j.isci.2020.101892. eCollection 2021 Jan 22.

NADPH performs mediated electron transfer in cyanobacterial-driven bio-photoelectrochemical cells

Affiliations

NADPH performs mediated electron transfer in cyanobacterial-driven bio-photoelectrochemical cells

Yaniv Shlosberg et al. iScience. .

Abstract

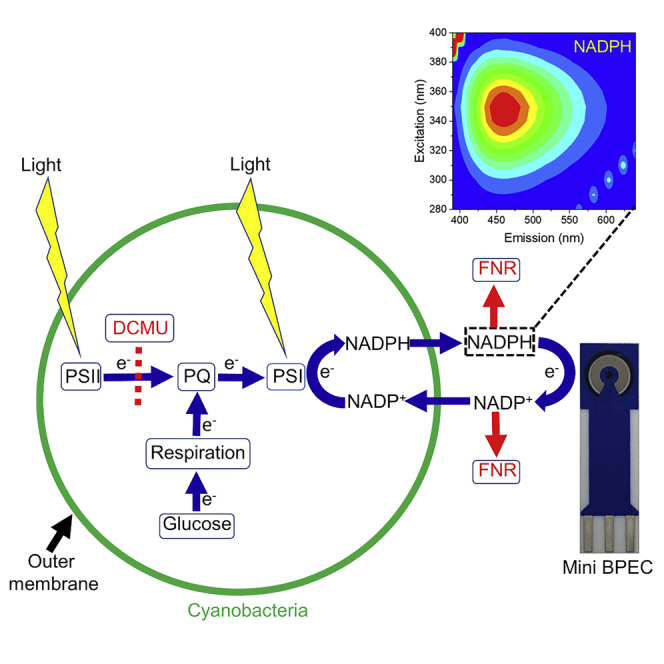
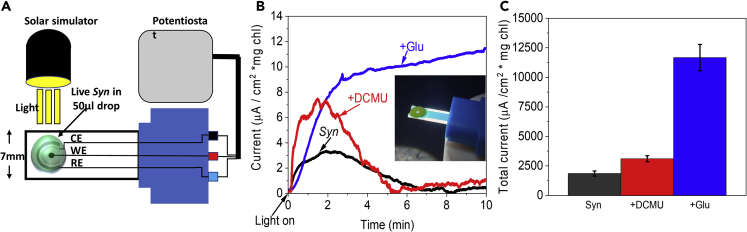
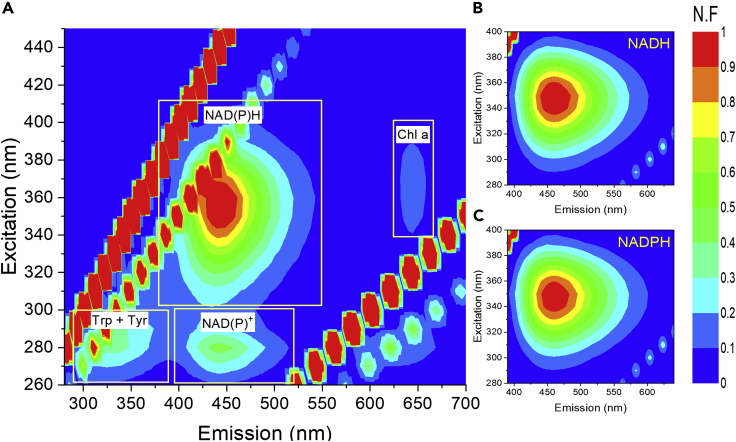
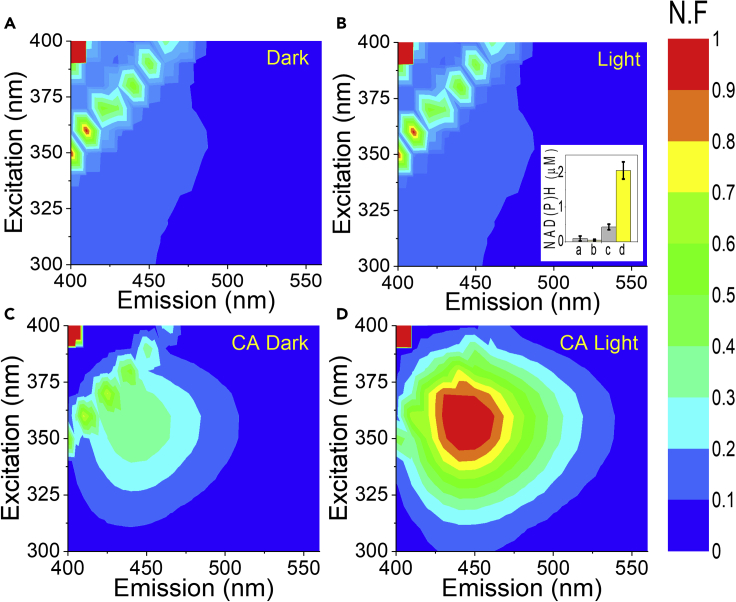
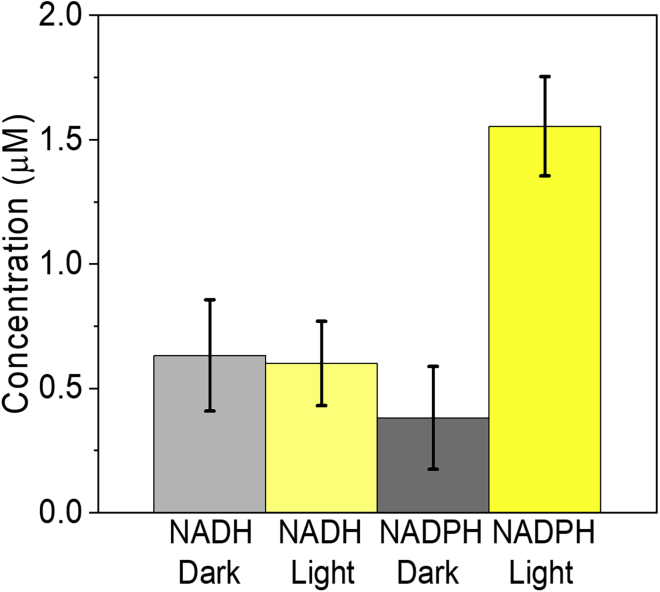
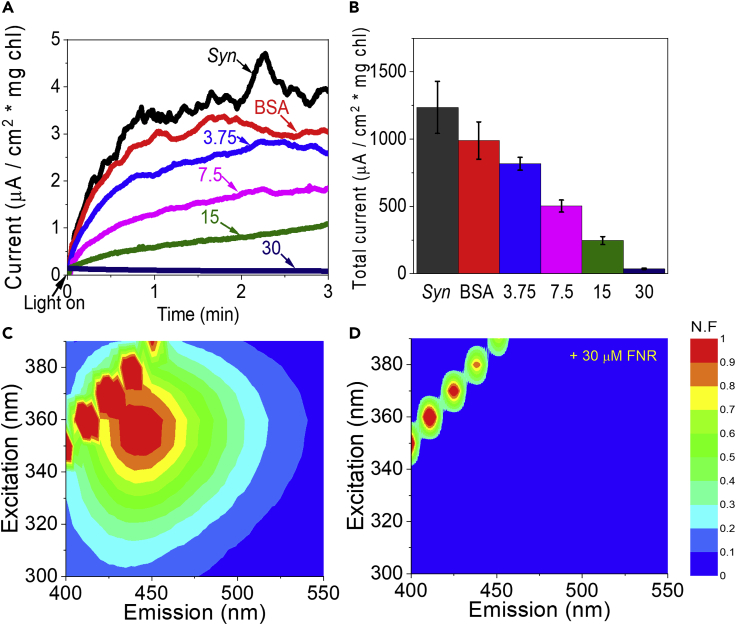
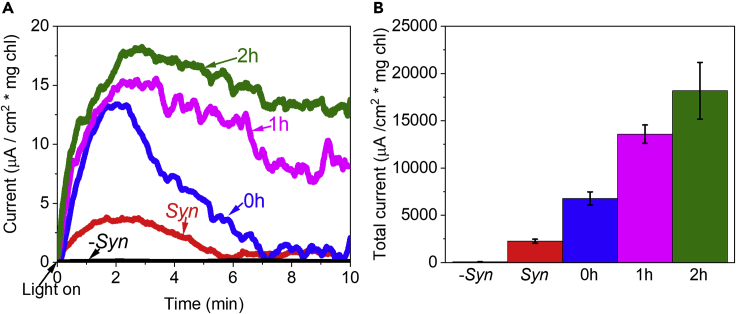
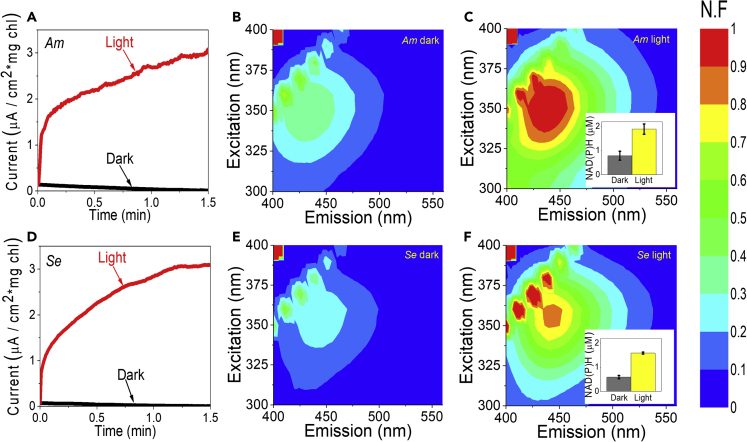
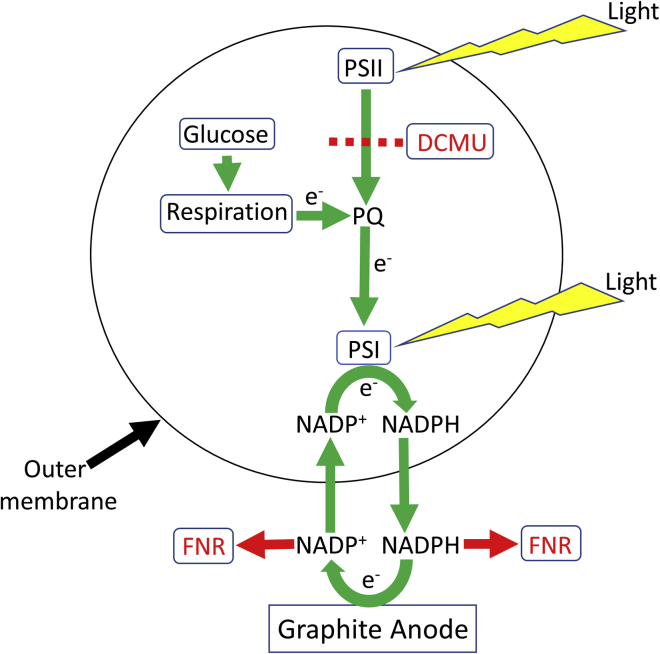
Previous studies have shown that live cyanobacteria can produce photocurrent in bio-photoelectrochemical cells (BPECs) that can be exploited for clean renewable energy production. Electron transfer from cyanobacteria to the electrochemical cell was proposed to be facilitated by small molecule(s) mediator(s) whose identity (or identities) remain unknown. Here, we elucidate the mechanism of electron transfer in the BPEC by identifying the major electron mediator as NADPH in three cyanobacterial species. We show that an increase in the concentration of NADPH secreted into the external cell medium (ECM) is obtained by both illumination and activation of the BPEC. Elimination of NADPH in the ECM abrogates the photocurrent while addition of exogenous NADP+ significantly increases and prolongs the photocurrent production. NADP+ is thus the first non-toxic, water soluble electron mediator that can functionally link photosynthetic cells to an energy conversion system and may serve to improve the performance of future BPECs.

Keywords: Bio-Electrochemistry; Biotechnology; Energy Engineering; Microbiology.


Conflict of interest statement

The authors declare no competing interests.

Figures

None
Graphical abstract
Figure 1
Figure 1
Light-dependent generation of electricity by live Syn Syn cells (5μg chlorophyll) were placed in a 50-μL drop on a minielectrode-based BPEC, and the light-dependent chronoamperometry (CA) measurement was performed applying a voltage bias of 0.5 V on the anode. (A) Schematic drawing of the mini-BPEC setup. (B) CA of the light-dependent produced current of live Syn (black), with the addition of 100 μM of the herbicide DCMU (+DCMU, red) and after a pre-incubation in dark for 1 hr with 5 mM glucose (+Glu, blue). A picture of the minielectrode BPEC is shown in the inset. (C) Calculation of the total current that was accumulated during 10 min in CA measurements of Syn (black), +DCMU (red), and +glucose (blue). The error bars represent the standard deviation over 3 independent measurements.
Figure 2
Figure 2
Identification of NAD(P)H in the ECM Normalized 2D-FM spectra of the ECM of Syn, NADH, and NADPH. (A) Normalized 2D-FMs of the ECM of Syn spectral fingerprints of the NAD(P)H, NAD(P)+, the amino acids Trp and Tyr, and chl a are marked above each peak. The lines of diagonal spots that appear in all of the maps presented here and in the following figures result from light scattering of the xenon lamp and Raman scattering of the water (Lawaetz and Stedmon, 2009). (B) Normalized 2D-FM spectra of 5 mM NADH. (C) Normalized 2D-FM spectra of 5 mM NADPH. In all panels, normalization was done by division of the intensity values of the whole map by the value of NAD(P)H signal obtained at (λ(ex) = 350, λ(em) = 450 nm). The fluorescence intensities in the color bar are displayed as normalized fluorescence (N.F).
Figure 3
Figure 3
Accumulation of NAD(P)H in the ECM is dependent on light and the connection between the cells and the electrochemical system 2D-FM spectra of the ECM of Syn after incubation in test tubes or during CA measurements on the electrodes in dark or under illumination. (A) In test tubes in the dark. (B) In test tubes under illumination. (C) On the electrodes after 100 s of CA measurement in the dark. (D) On the electrodes after 100 s of CA measurement under illumination. The inset in (B) displays NAD(P)H concentrations which were calculated based on the fluorescence intensities at (λ(ex) 350 = nm, λ(em) = 450 nm). The error bars in the insert of (B) represents the standard deviation over 6 independent measurements. The fluorescence intensities in the color bar are displayed as normalized fluorescence (N.F).
Figure 4
Figure 4
When illuminated, NADPH accumulates in the Syn ECM more than NADH Quantification of NADH and NADPH concentrations in the ECM of Syn, after 100 s of CA measurement with or without illumination, was done using a chemical enzymatic assay. The error bars represent the standard deviation over 9 independent measurements.
Figure 5
Figure 5
Addition of FNR that binds NAD(P)H eliminates both the light-dependent electric current and the NAD(P)H accumulation in the ECM (A) CA of Syn (black) and Syn + BSA (red, negative control), and Syn + 3.75, 7.5, 15, and 30 μM FNR (light blue, magenta, green, and dark blue, respectively). (B) Calculations of the current sum that was accumulated during 3 min in CA measurements of Syn (black), + Syn + BSA (red), and Syn + 3.75, 7.5, 15 and 30 μM FNR (light blue, magenta, green, and dark blue, respectively). The error bars represent the standard deviation over 3 independent measurements. (C) 2D-FM of Syn filtrate. (D) 2D-FM of Syn + FNR filtrate. The ECMs of Syn, with and without the addition of FNR at the concentration of 1 mg/mL, were filtrated through a 3 kD filter and measured with 2D-FMs. The fluorescence intensities in the color bar are displayed as normalized fluorescence (N.F).
Figure 6
Figure 6
Addition of NADP+ enhances photocurrent production (A) CA measurement of Syn cells with or without pre-incubation with 5 mM NADP+ for 0, 1, and 2 hr under continuous illumination. NADP+ without cells (-Syn, black), Syn without NADP+ (red), Syn after 0, 1, and 2 hr incubation with NADP+ (blue, magenta, and green respectively). (B) Calculations of the current sum that was accumulated during 10 min in CA measurements of NADP+ without cells (-Syn, black), Syn without NADP+ (red), Syn after 0, 1, and 2 hr incubation with NADP+ (blue, magenta, and green respectively). The error bars represent the standard deviation over 3 independent measurements.
Figure 7
Figure 7
Am and Se exhibit light-driven current and export NADP(H) into the BPEC ECM similar to Syn CA of Am and Se cells was measured for 100 s in dark and under illumination. The cells were filtrated immediately following the measurement, and 2D-FM spectra of their ECMs were measured. (A) CA of Am cells in dark (black) and under illumination (red). (B) 2D-FM spectra of the ECM of Am after measurements in dark. (C) 2D-FM spectra of the ECM of Am after measurements under illumination. (D) CA of Se cells in dark (black) and under illumination (red). (E) 2D-FM spectra of the ECM of Se after measurements in dark. (F) 2D-FM spectra of the ECM of Se after measurements under illumination. The inset in (C) and (F) displays NAD(P)H concentrations which were calculated based on the fluorescence intensities at (λ(ex) = 340 nm, λ(em) = 450 nm) after incubation in dark and under illumination. The error bars represent the standard deviation over 6 independent measurements. The fluorescence intensities in the color bar are displayed as normalized fluorescence (N.F).
Figure 8
Figure 8
Schematic depiction of the main electron transport pathway in cyanobacterial BPECs The electron transport originates from the respiratory pathway which reduces the PQ pool and continues downstream to PSI which under illumination reduces NADP + to NADPH. NADPH exits the stroma (cytoplasm) and outer membrane to the ECM and reduces the graphite anode. It then re-enters the cyanobacterial cells to accept more electrons from PSI. Yellow flash shapes indicate the light illumination which is absorbed in the photosystems. Green arrows represent the directionality of the electron transport pathway. Black arrows indicate the internal and outer cell membranes. A dashed line represents the electron blockage between PSII and the plastoquinone pool (PQ) in the presence of DCMU. Red arrows represent the binding of NADP+ and NADPH to exogenous FNR that prevent them from reducing the anode or re-entering the cell and in this manner abrogate the current production.

References

    1. Batie C.J., Kamin H. Association of ferredoxin-NADP+ reductase with NADP(H) specificity and oxidation-reduction properties. J. Biol. Chem. 1986;261:11214–11223. - PubMed
    1. Bergel A., Féron D., Mollica A. Catalysis of oxygen reduction in PEM fuel cell by seawater biofilm. Electrochem. Commun. 2005;7:900–904.
    1. Blacker T.S., Mann Z.F., Gale J.E., Ziegler M., Bain A.J., Szabadkai G., Duchen M.R. Separating NADH and NADPH fluorescence in live cells and tissues using FLIM. Nat. Commun. 2014;5:3936. - PMC - PubMed
    1. Blankenship R.E., Tiede D.M., Barber J., Brudvig G.W., Fleming G., Ghirardi M., Gunner M.R., Junge W., Kramer D.M., Melis A. Comparing photosynthetic and photovoltaic efficiencies and recognizing the potential for improvement. Science. 2011;332:805–809. - PubMed
    1. Bombelli P., Müller T., Herling T.W., Howe C.J., Knowles T.P.J. A high power-density, mediator-free, microfluidic biophotovoltaic device for cyanobacterial cells. Adv. Energy Mater. 2015;5:1–6. - PMC - PubMed

LinkOut - more resources