. 2020 Dec 7;24(1):101893.
doi: 10.1016/j.isci.2020.101893. eCollection 2021 Jan 22.

Crosstalk between vrille transcripts, proteins, and regulatory elements controlling circadian rhythms and development in Drosophila

Affiliations

Crosstalk between vrille transcripts, proteins, and regulatory elements controlling circadian rhythms and development in Drosophila

Kushan L Gunawardhana et al. iScience. .

Abstract

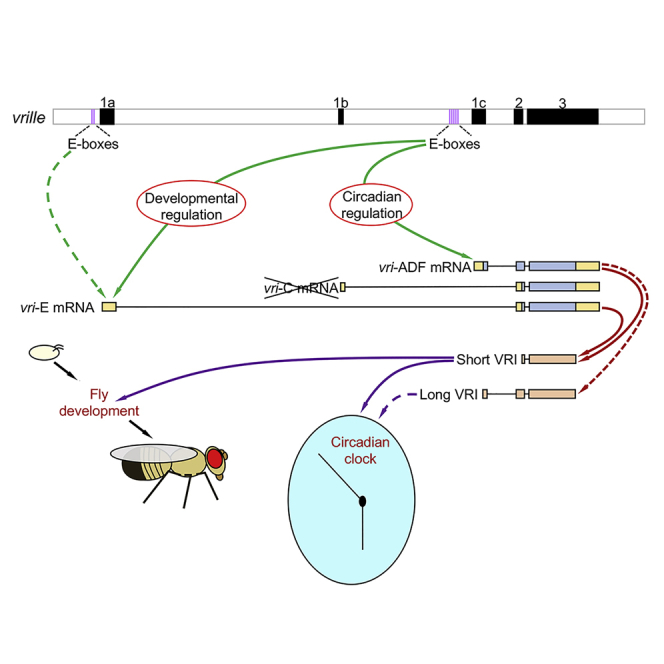
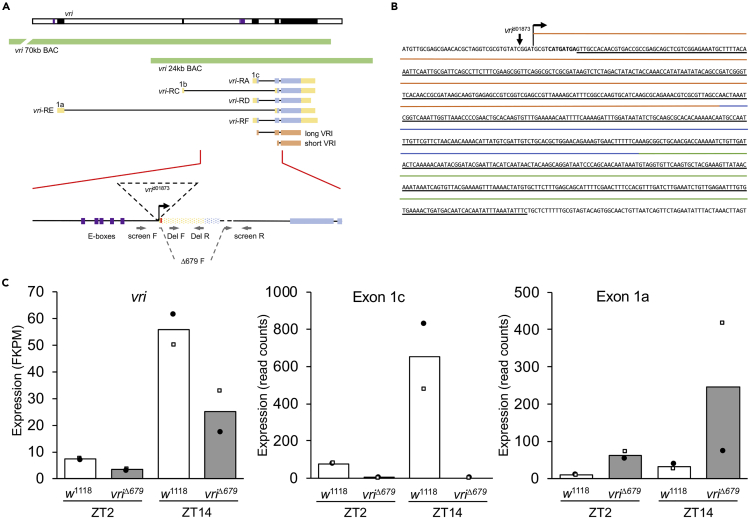
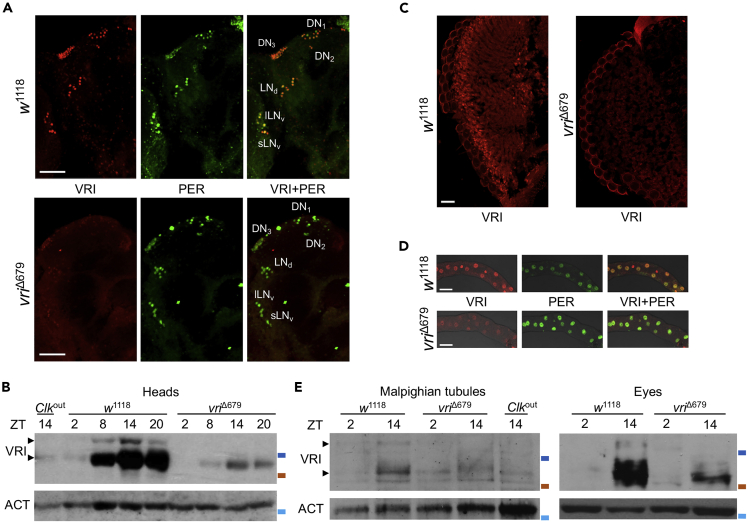
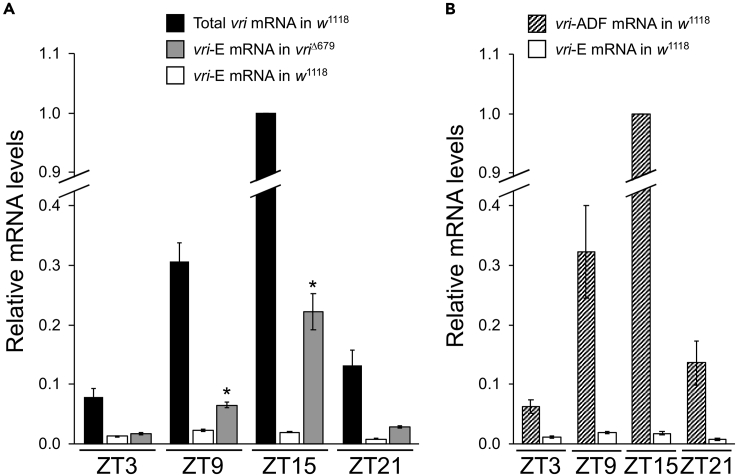
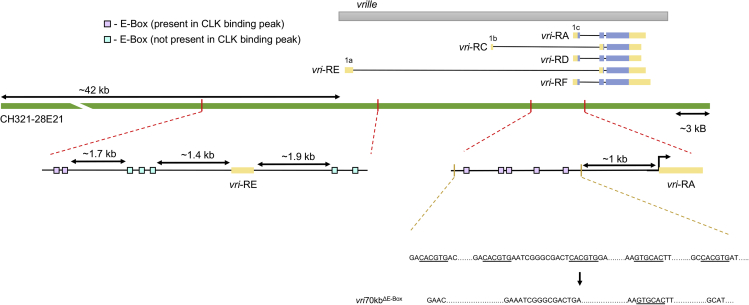
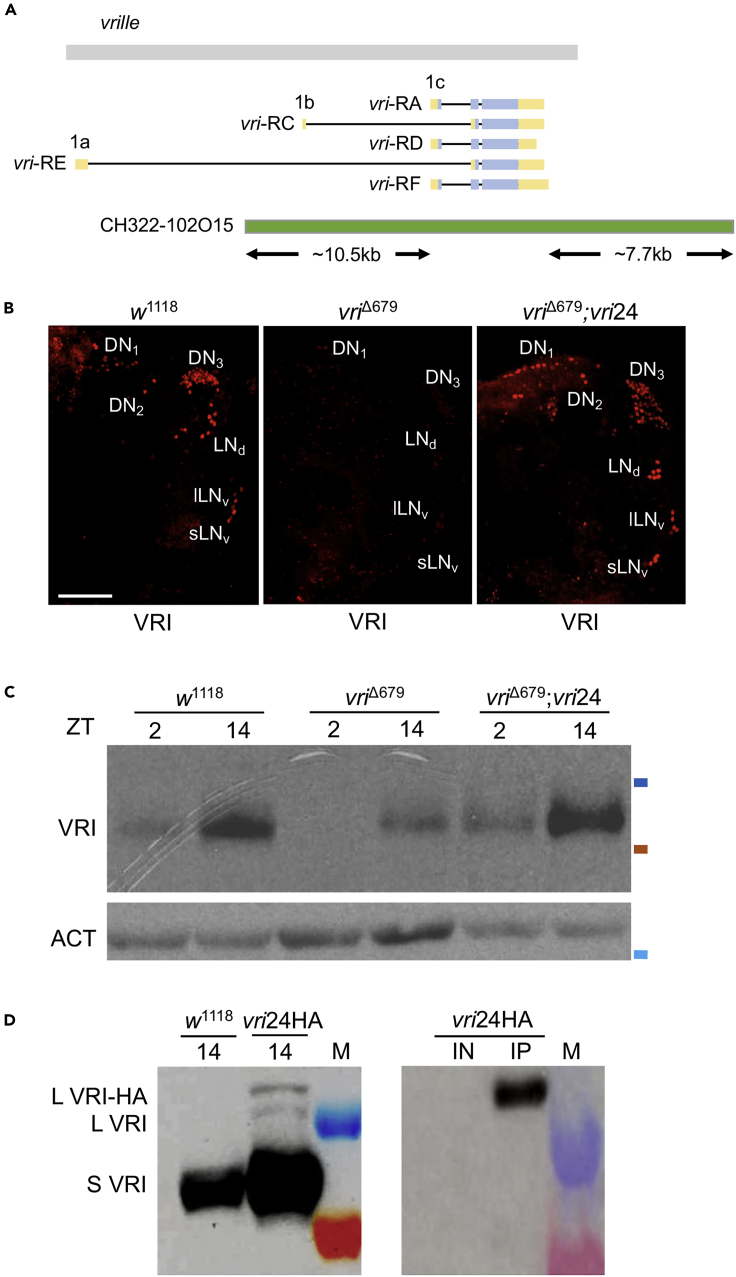
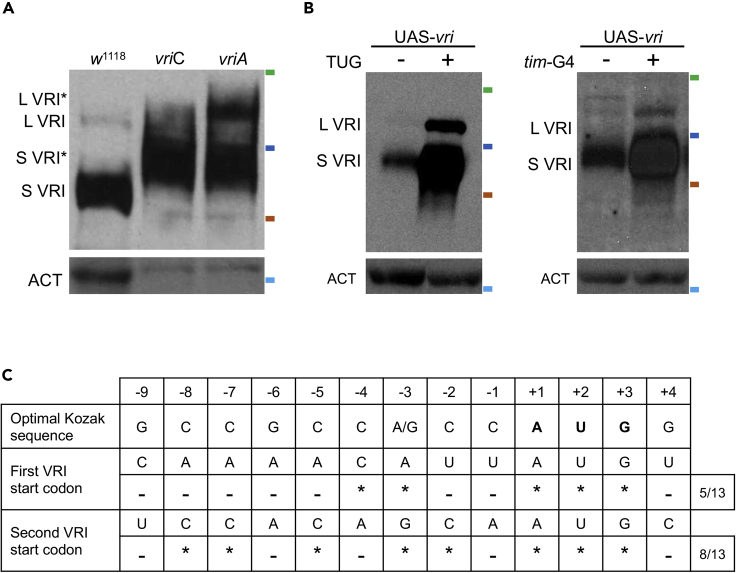
The vrille (vri) gene encodes a transcriptional repressor required for Drosophila development as well as circadian behavior in adults. Alternate first exons produce vri transcripts predicted to produce a short VRI isoform during development and long VRI in adults. A vri mutant (vri Δ679) lacking long VRI transcripts is viable, confirming that short VRI is sufficient for developmental functions, yet behavioral rhythms in vri Δ679 flies persist, showing that short VRI is sufficient for clock output. E-box regulatory elements that drive rhythmic long VRI transcript expression are required for developmental expression of short VRI transcripts. Surprisingly, long VRI transcripts primarily produce short VRI in adults, apparently due to a poor Kozak sequence context, demonstrating that short VRI drives circadian behavior. Thus, E-box-driven long VRI transcripts primarily control circadian rhythms via short VRI, whereas the same E-boxes drive short VRI transcripts that control developmental functions using short VRI.

Keywords: Developmental Genetics; Molecular Biology.


Conflict of interest statement

The authors declare no competing interests.

Figures

None
Graphical abstract
Figure 1
Figure 1
vriΔ679 mutants lack vri-ADF transcript expression (A) The vri genomic region (white box) showing vri exons (black boxes) and canonical E-box regulatory elements (purple lines) is depicted above the vri 70-kb BAC and vri 24-kb BAC transgenes (green boxes) that were used to rescue developmental and circadian function in vri mutants (see Figures 4 and 5). The five vri mRNA isoforms (RA, RC, RD, RE, RF) and the three alternate first exons (1a, 1b, 1c) are shown, where exons for different vri transcripts are shown as boxes denoting untranslated (yellow) or translated (blue) regions. The five vri transcripts produce short VRI or long VRI isoforms, depicted by orange boxes corresponding to their exon coding sequences. A magnified view of the vri genomic region bracketed by the red lines is shown below the short VRI and long VRI isoforms. Canonical E-box regulatory elements (purple boxes) are shown upstream of the vrid01873 P element (dashed triangle), which is located 4 bp upstream of exon 1c. Imprecise excision of vrid01873 produced a deletion removing most of exon 1 (stippled yellow and blue region) and a part of intron 1 (dashed line) and inserted an 8-bp sequence (red). The location and orientation (gray arrows) of the screen forward (screen F), screen reverse (screen R), Δ679 forward (Δ679 F), Deletion forward (Del F), and Deletion reverse (Del R) primers used to identify and characterize vri deletions are denoted. (B) Sequence of the vri exon 1c region showing the vrid01873 P element insertion site, the vriΔ679 deletion (underlined nucleotides), the 5′ untranslated region (orange line), the translated region (blue line), intron 1 (green line), and the 8-bp insertion (bold). (C) RNA-seq analysis of vri expression in heads from w1118 and vriΔ679 flies collected at ZT2 and ZT14 during LD cycles. The left graph shows composite mRNA expression levels in fragments per kilobase million (FPKM) for all vri mRNA isoforms (vri), the middle graph shows mRNA expression levels in read counts for exon 1c, and the right graph shows mRNA expression levels in read counts for exon 1a. Data from the two biological replicates are shown as black circles and white squares, and the average is shown by the bar height.
Figure 2
Figure 2
Low-level rhythms in VRI expression are observed in vriΔ679 mutants (A) Brains from control w1118 and vriΔ679 flies were collected at ZT20 and were immunostained with VRI (red) and PER (green) antisera. Merged VRI + PER images are shown in yellow. The following brain pacemaker neuron groups were detected: dorsal neuron 1 (DN1), dorsal neuron 2 (DN2), dorsal neuron 3 (DN3), dorsal lateral neuron (LNd), large ventrolateral neuron (lLNv), and small ventrolateral neuron (sLNv). Scale bars, 50 μm. (B) Proteins from the heads of w1118, vriΔ679, and Clkout flies collected during LD at zeitgeber time (ZT) 2, 8, 14, and 20 were used to prepare western blots. Westerns probed with VRI antiserum showed rhythmically expressed high- and low-mobility VRI bands (arrowheads). β-Actin (ACT) was used as a loading control. Molecular weight marker positions to the right are 95 kDa (blue) and 72 kDa (orange) on the VRI blot and 37 kDa (light blue) on the ACT blot. (C) Heads from w1118 and vriΔ679 mutant flies collected at ZT20 were cryosectioned and immunostained with VRI antiserum. Images of compound eyes are shown, with VRI (red) staining detected in photoreceptor nuclei (white arrows). Scale bars, 20 μm. (D) Malpighian tubules from w1118 and vriΔ679 mutant flies collected at ZT20 were immunostained with VRI (red) and PER (green) antisera. Merged VRI + PER images are shown as yellow. Scale bars, 50 μm. (E) Proteins from Malpighian tubule tissue samples (left) and compound eyes (right) of w1118 and vriΔ679 flies collected during LD at ZT2 and ZT14 were used to prepare western blots. Westerns probed with VRI antiserum showed rhythmically expressed high- and low-mobility VRI bands (arrowheads). β-Actin (ACT) was used as a loading control. Molecular weight marker positions to the right are 95 kDa (blue) and 72 kDa (orange) on the VRI blots and 37 kDa (light blue) on the ACT blots.
Figure 3
Figure 3
vri-E mRNA cycling and upregulation in vriΔ679 flies (A) RT-qPCR quantification of total vri mRNA levels in heads of w1118 flies (black bar), vri-E mRNA levels in heads of vriΔ679 flies (gray bars), and vri-E mRNA levels in heads of w1118 flies (white bar) collected at the indicated times during LD. Levels of vri-E mRNA are relative to the total vri mRNA level at ZT15 in w1118 flies, which was set to 1.0. ∗ Abundance of vri-E mRNA is significantly (p ≤ 0.0002) lower than total vri mRNA based on Student's two-tailed t test. (B) RT-qPCR quantification of vri-ADF (hatched bar) and vri-E (white bar) mRNA levels in heads of w1118 flies collected at the indicated times during LD. Levels of vri-ADF and vri-E mRNAs are relative to the vri-ADF mRNA peak at ZT15, which was set to 1.0.
Figure 4
Figure 4
Diagram of vri70kbΔE−Box transgene A ~70-kb BAC clone (CH321-28 × 1021), which is ~42 kb upstream and ~3 kb downstream of the vri gene, was used to generate the vri70kbΔE−Box transgene. Multiple E-box regulatory sequences are found nearby vri exons 1a and 1c (expanded diagram with red dashed lines) which are found within CLK binding peaks (aqua boxes) or outside CLK binding peaks (purple boxes). Four of the five E-boxes within 2.5 kb upstream of exon 1c were deleted (expanded diagram with brown dashed lines) to generate the vri70kbΔE−Box mutant transgene containing one intact E-box.
Figure 5
Figure 5
vri24kb transgene rescues vriΔ679 mutant phenotypes (A) Diagram depicting the ~24-kb BAC clone (CH322-102O15) that was used to generate the vri24 transgene (green rectangle), which produces a V5-3xHA epitope-tagged VRI protein. This BAC clone is ~10.5 kb upstream of the vri-ADF mRNA transcription start site and ~7.7 kb downstream of vri-ADF mRNAs. (B) Brains from wild-type (w1118), vriΔ679 mutants, and vriΔ679; vri24 flies were collected at ZT19 and were immunostained with VRI antisera. The following brain pacemaker neuron groups were detected: dorsal neuron 1 (DN1), dorsal neuron 2 (DN2), dorsal neuron 3 (DN3), dorsal lateral neuron (LNd), large ventrolateral neuron (lLNv), and small ventrolateral neuron (sLNv). Scale bar, 50 μm. (C) Protein from the heads of w1118, vriΔ679 mutants and vriΔ679; vri24 flies collected during LD at the specified times were used to generate western blots that were probed with VRI antiserum. β-Actin (ACT) was used as a loading control. Molecular weight marker positions to the right of the blot are 95 kDa (blue) and 72 kDa (orange) on the VRI blot and 37 kDa (light blue) on the ACT blot. (D) Protein from the heads of w1118 flies containing vri24HA and w1118 control flies collected at ZT14 were used to generate western blots that were probed with VRI antiserum (left). Protein from the heads of w1118 flies containing vri24HA collected at ZT14 was run directly as input (IN) or as an immunoprecipitate (IP) using VRI antibody on western blots that were probed with HA antiserum (right). Long-VRI, short-VRI, and VRI-HA bands are detected next to the 95 kD (blue) and 72 kD (red) protein markers.
Figure 6
Figure 6
vri-ADF mRNAs generate short protein using an alternative translation initiation site (A) Western blot of proteins from heads of w1118 flies collected at ZT15 and S2 cells overexpressing vriC and vriA transcripts were probed with VRI antiserum. β-Actin (ACT) was used as a loading control. Long VRI, L-VRI; Long VRI-FLAG-HA, L-VRI∗; Short VRI, S-VRI; Short VRI-FLAG-HA, S-VRI∗. Molecular weight marker positions to the right are 130 kDa (green), 95 kDa (blue), and 72 kDa (orange) on the VRI blot and 37 kDa (light blue) on the ACT blot. (B) Western blots of proteins from heads of flies collected at ZT15 that contain (left) UAS-vri only (−) and UAS-vri driven by tim-(UAS)-Gal4 (+) or (right) vrid01873 only (−) and vrid01873 driven by tim-Gal4 (+) were probed with VRI antiserum. Loading control and abbreviations are as described in (A). Molecular weight markers to the right are 130 kDa (green), 95 kDa (blue), and 72 kDa (orange) on the VRI blot and 37 kDa (light blue) on the ACT blot. (C) Sequence comparison of Kozak sequences associated with the long VRI translation initiation codon (first VRI start codon) and the short VRI translation initiation codon (second VRI start codon) to the optimal Kozak sequence for Drosophila melanogaster. An asterisk (∗) indicates a match, a dash (−) indicates a difference, and the number of matches of the 13 residues is noted at end of the row. The numbering on top represents the location of each base with respect to the first base of the translation initiation codon (+1).

Similar articles

Cited by

References

    1. Abruzzi K.C., Rodriguez J., Menet J.S., Desrochers J., Zadina A., Luo W., Tkachev S., Rosbash M. Drosophila CLOCK target gene characterization: implications for circadian tissue-specific gene expression. Genes Dev. 2011;25:2374–2386. - PMC - PubMed
    1. Allada R., Kadener S., Nandakumar N., Rosbash M. A recessive mutant of Drosophila Clock reveals a role in circadian rhythm amplitude. EMBO J. 2003;22:3367–3375. - PMC - PubMed
    1. Blau J., Young M.W. Cycling vrille expression is required for a functional Drosophila clock. Cell. 1999;99:661–671. - PubMed
    1. Cyran S.A., Buchsbaum A.M., Reddy K.L., Lin M.C., Glossop N.R., Hardin P.E., Young M.W., Storti R.V., Blau J. vrille, Pdp1, and dClock form a second feedback loop in the Drosophila circadian clock. Cell. 2003;112:329–341. - PubMed
    1. Darlington T.K., Wager-Smith K., Ceriani M.F., Staknis D., Gekakis N., Steeves T.D., Weitz C.J., Takahashi J.S., KAY S.A. Closing the circadian loop: CLOCK-induced transcription of its own inhibitors per and tim. Science. 1998;280:1599–1603. - PubMed