. 2020 Dec 7;24(1):101900.
doi: 10.1016/j.isci.2020.101900. eCollection 2021 Jan 22.

NLRC5 promotes transcription of BTN3A1-3 genes and Vγ9Vδ2 T cell-mediated killing

Affiliations

NLRC5 promotes transcription of BTN3A1-3 genes and Vγ9Vδ2 T cell-mediated killing

Anh Thu Dang et al. iScience. .

Abstract

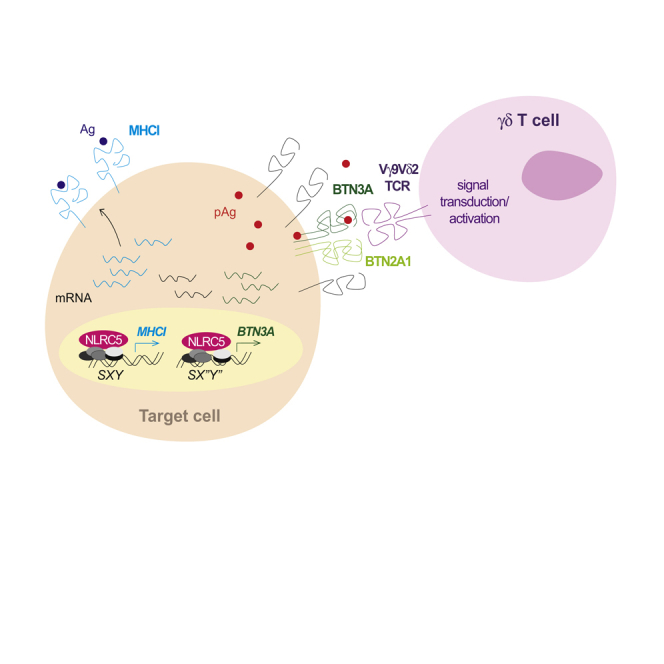
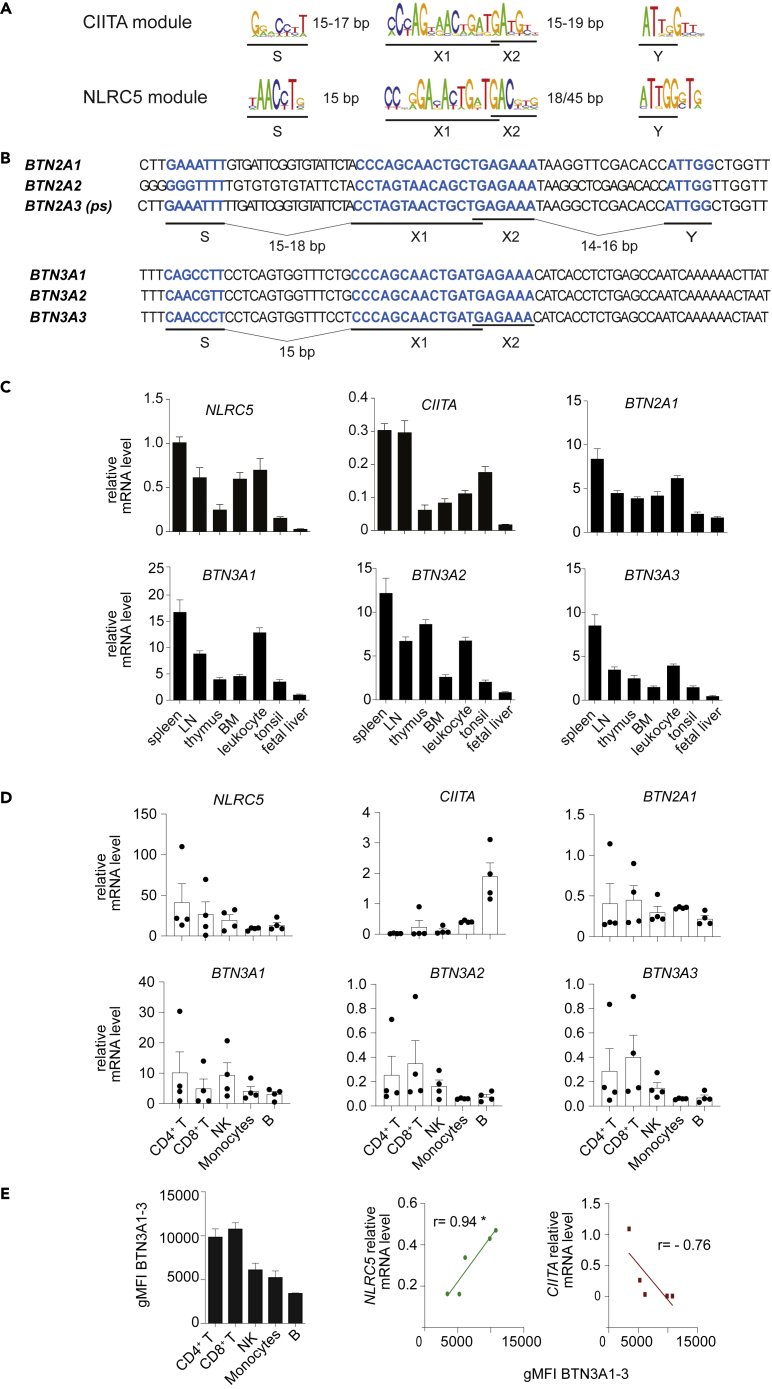
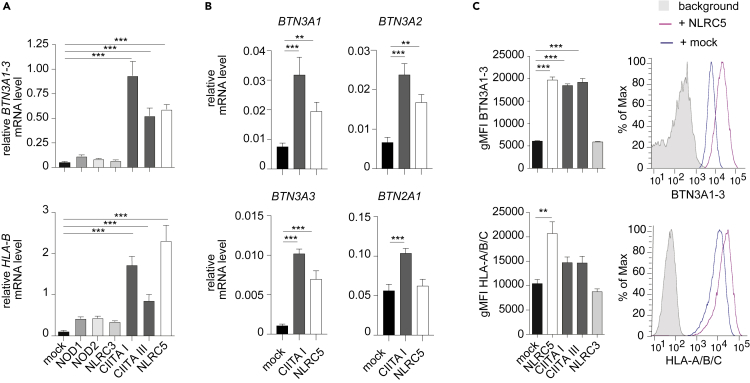
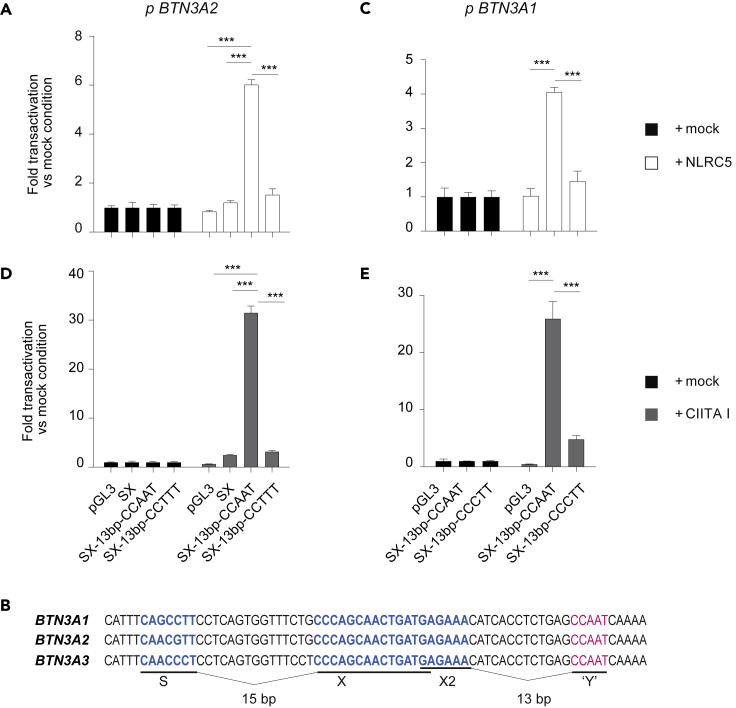
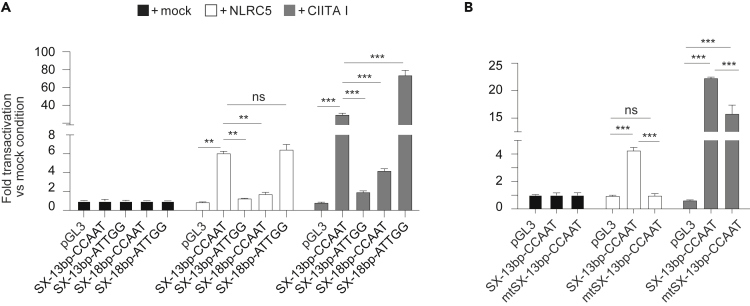
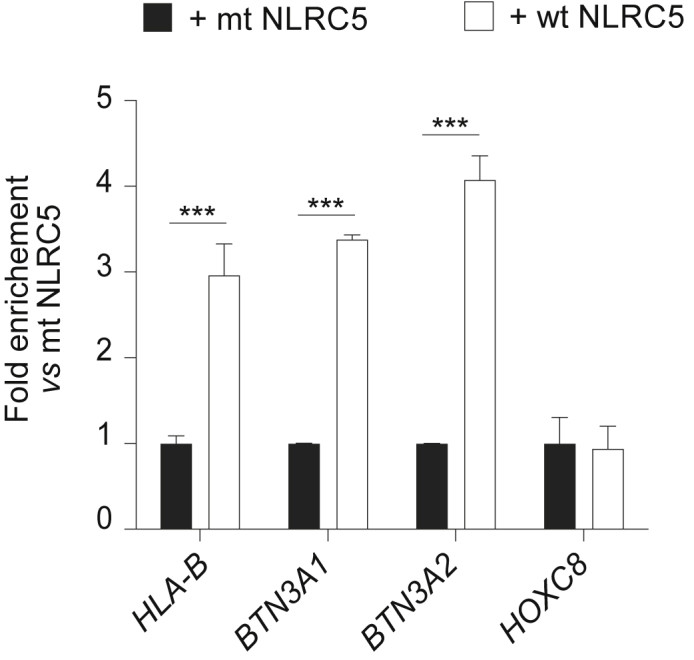
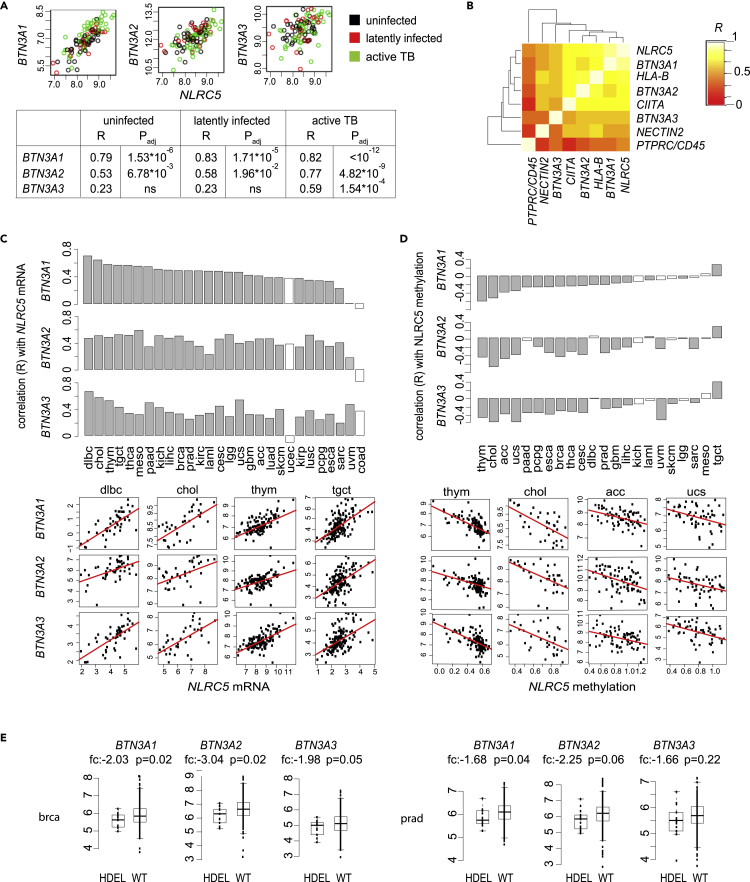
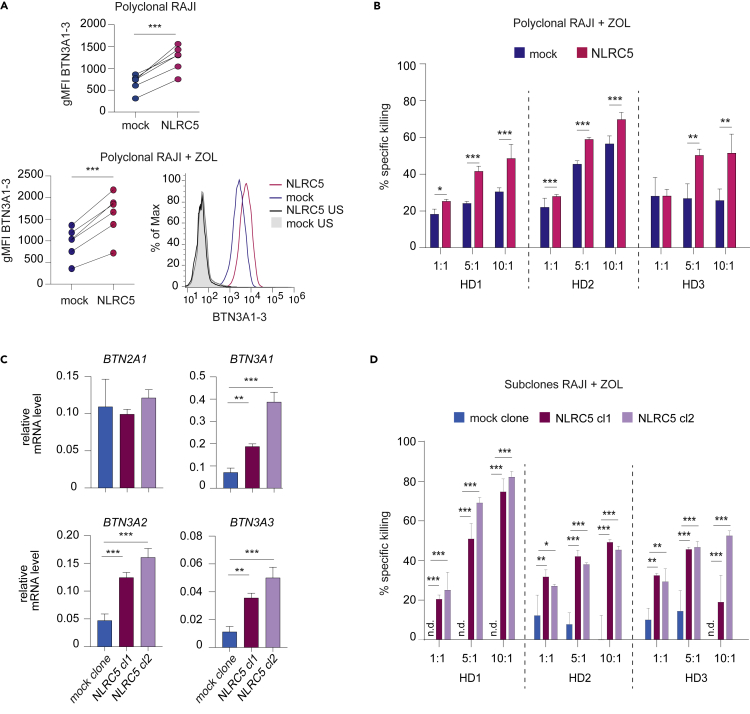
BTN3A molecules-BTN3A1 in particular-emerged as important mediators of Vγ9Vδ2 T cell activation by phosphoantigens. These metabolites can originate from infections, e.g. with Mycobacterium tuberculosis, or by alterations in cellular metabolism. Despite the growing interest in the BTN3A genes and their high expression in immune cells and various cancers, little is known about their transcriptional regulation. Here we show that these genes are induced by NLRC5, a regulator of MHC class I gene transcription, through an atypical regulatory motif found in their promoters. Accordingly, a robust correlation between NLRC5 and BTN3A gene expression was found in healthy, in M. tuberculosis-infected donors' blood cells, and in primary tumors. Moreover, forcing NLRC5 expression promoted Vγ9Vδ2 T-cell-mediated killing of tumor cells in a BTN3A-dependent manner. Altogether, these findings indicate that NLRC5 regulates the expression of BTN3A genes and hence open opportunities to modulate antimicrobial and anticancer immunity.

Keywords: Cell Biology; Immunology; Microbiology.


Conflict of interest statement

Other projects in G.G. laboratory are supported by OM-Pharma, Meyrin, IFM Therapeutics, Boston, and Novartis Foundation. Unrelated projects in SM laboratory are supported by the Eurostars program (EUROPEAN UNION HORIZON, 2020 FRAMEWORK PROGRAM).

Figures

None
Graphical abstract
Figure 1
Figure 1
BTN3A promoters present conserved S- and X-boxes (A) The sequence logo for the human CIITA and mouse NLRC5 SXY consensus are shown. (B) Sequence alignment of the S-, X-, and Y-motifs located within the proximal promoter region of human BTN2A1, BTN2A2, BTN2A3 (ps, pseudogene), BTN3A1, BTN3A2, and BTN3A3 genes. The sequences corresponding to the S-, X-, and Y-motifs are highlighted in blue and distances between them are indicated. (C and D) NLRC5, CIITA, BTN2A1, and BTN3A1-3 mRNA levels (relative to POLR2A mRNA) were assessed by quantitative RT-PCR (qRT-PCR) in the indicated human tissues (C) and in blood-derived CD4+ T cells (CD4+CD3+), CD8+ T cells (CD8+CD3+), NK cells (CD56+CD3), monocytes (CD14+CD3), and B cells (CD19+CD3) (D). (E) Geometric mean fluorescence intensity (gMFI) of BTN3A1-3 (CD277) as measured by flow cytometry in the indicated blood-derived cell subsets (on the left) and the correlation of the mean value with those of NLRC5 and CIITA mRNA levels measured by qRT-PCR in the same cells (on the right). Spearman's correlation coefficient (R) and significance are indicated. (C–E) Results illustrate mean ± SD of n = 3 technical replicates (C) and mean ± SEM of n = 4 (D) and n = 3 (E) individual donors. Lymph node, LN; bone marrow, BM. ∗p < 0.05
Figure 2
Figure 2
NLRC5 overexpression increases BTN3A1-3 expression (A and B) BTN3A1-3, BTN2A1, or HLA-B mRNA levels (relative to POLR2A mRNA) were measured by qRT-PCR 48 h following transfection of plasmids encoding the indicated NLR proteins or an empty vector (mock) in HEK293T. (C) HEK293T cells were co-transfected with vectors coding for the indicated NLRs or empty vector (mock) and a GFP-encoding plasmid to identify transfected cells. Graphs depict the quantification of HLA-A/B/C and BTN3A1-3 geometric MFI (gMFI) gating on GFP+ cells 48 h post-transfection. Histogram overlays show HLA-A/B/C and BTN3A1-3 expression for background (gray), mock- (blue), and NLRC5-transfected (pink) HEK293T cells. (A–C) Results are depicted as mean ± SD (n = 3 technical replicates) and are representative of at least two independent experiments. Statistical differences were determined by one-way ANOVA followed by comparison of the experimental conditions to the corresponding mock transfection and were corrected for multiple testing using the Dunnett method. Only statistically significant differences are illustrated. ∗∗p < 0.01; ∗∗∗p < 0.001.
Figure 3
Figure 3
BTN3A genes harbor an atypical but functional SXY module (A, C–E) Luciferase reporter assays were performed in HEK293T cells co-transfected with the parental pGL3 backbone or the indicated BTN3A2 (A, D) or BTN3A1 (C, E) promoter constructs, and an empty (mock) vector, or a vector coding for NLRC5 (A, C) or CIITA (D, E). SX-13bp-CCAAT contains the BTN3A1 or BTN3A2 promoter region, as indicated, with S-, X-, and 13 bp downstream CCAAT-box; where indicated, the CCAAT-box was mutated. (B) Alignment of the proximal BTN3A1-3 promoter region containing S- and X-motifs highlighted in blue and a 13 bp downstream “Y” CCAAT-box highlighted in pink. Distances between motifs are indicated. (A and C–E) Data are expressed as fold transactivation as compared with the mock condition. Results represent mean ± SD of n = 3 (A and D) and n = 4 (C and E) technical replicates and are representative of at least two independent experiments. Statistical differences were determined by performing a two-way ANOVA followed by comparison of the SX-13bp-CCAAT condition to the others transfected with the same NLR and were corrected for multiple testing using the Holm-Sidak method. Only statistically significant differences are illustrated. ∗∗∗p < 0.001.
Figure 4
Figure 4
S-box sequence and CCAAT-box position are important for NLRC5 transactivation (A and B) Luciferase reporter assays were performed in HEK293T cells co-transfected with the parental pGL3 backbone or the indicated BTN3A2 promoter constructs, and a vector coding for NLRC5 or CIITA I, or an empty (mock) vector; mtSX indicates a scrambled S-box sequence (the CAACGTT sequence was substituted by CCAGAGT) (B). Data are expressed as fold transactivation as compared to the mock condition. Results represent mean ± SD of n = 3 technical replicates and are representative of at least three independent experiments. Statistical differences were determined by performing a two-way ANOVA followed by comparison of the indicated conditions and were corrected for multiple testing using the Holm-Sidak method. ∗∗p < 0.01; ∗∗∗p < 0.001; ns: not significant.
Figure 5
Figure 5
NLRC5 directly binds to BTN3A promoter regions Vectors encoding human wild-type NLRC5 (wt NLRC5) or Walker A mutant (mt NLRC5) were cotransfected with CD72 into HEK293T. Forty-eight hours later, CD72-positive cells were MACS enriched and chromatin prepared. Binding of NLRC5 to the indicated promoters was assessed by chromatin immunoprecipitation (ChIP) followed by quantitative PCR. Results are expressed as fold enrichment as compared with the mt NLRC5 condition. Results are depicted as the mean ± SD of n = 3 technical replicates and are representative of at least two independent experiments. Statistical differences were determined by performing a two-way ANOVA followed by comparison of the wt NLRC5 with mt NLRC5 transfection and were corrected for multiple testing using the Holm-Sidak method. ∗∗∗p < 0.001.
Figure 6
Figure 6
BTN3A1-3 expression correlates with NLRC5 levels (A and B) Pairwise correlation of NLRC5 and BTN3A1, BTN3A2, BTN3A3 expression are visualized. Analyses were performed using transcriptome datasets of the Gambia M. tuberculosis (TB) cohort study (GSE28623). (A) Scatterplots of gene expression are shown. The samples are divided in the groups “uninfected” (black), “latently infected” (red), and “active TB” (green). The table displays the Spearman's correlation coefficient (R), and Bonferroni adjusted p values (p.adj) for the 3 groups. (B) Pairwise correlations of NLRC5 and selected genes are visualized using a heatmap and hierarchical clustering tree of Spearman's rank correlations. Correlations were calculated on the entire cohort. (C–E) Data from The Cancer Genome Atlas (TCGA) provisional dataset collections were analyzed after adjustment for CD45 expression. (C) Spearman's correlation coefficient (R values) for NLRC5 and BTN3A1, BTN3A2, or BTN3A3 mRNA expression across cancer types. Scatterplots are shown for the top-ranked cancer types. (D) Spearman's correlation coefficient for NLRC5 promoter methylation and BTN3A1, BTN3A2, or BTN3A3 mRNA expression across cancer types. Scatterplots are shown for the best-ranked cancer types. (C, D) Gray bars indicate significant correlations (p < 0.05 after Bonferroni correction) and white bars non-significant ones. (E) BTN3A1, BTN3A2, and BTN3A3 mRNA abundance is plotted according to NLRC5 copy number status. fc: fold change of expression in HDEL (n = 14 and n = 13 for brca and prad, respectively) over WT group (n = 272 and n = 361 for brca and prad, respectively). HDEL: homozygous deletion; WT: wild type. Two group comparisons were performed using unpaired t tests, two-tailed, unequal variance, and p values are indicated. Cancer types' abbreviations are described in the Transparent Methods section.
Figure 7
Figure 7
NLRC5 favors the activation of Vγ9Vδ2 T cells (A) Polyclonal Raji cells were transduced with NLRC5-coding or mock vector and treated with zoledronate (+ZOL) for 24 h (bottom panel) or left untreated (top panel). BTN3A1-3 surface expression was analyzed by flow cytometry. Graphs depict a quantification of BTN3A1-3 geometric MFI (gMFI; top and bottom left), and the histogram overlays (bottom right) show BTN3A1-3 expression for unstained (US; black, gray), mock- (blue) and NLRC5-transfected polyclonal Raji cells (pink). Results represent six independent measurements. (B) Specific killing of NLRC5- (pink) or mock-transduced polyclonal Raji cells (blue) was measured after 24 h of co-culture with Vγ9Vδ2 T cells at 3 effector-to-target ratios (1:1, 5:1, and 10:1) in the presence of ZOL. Depicted are the results for three independent healthy donors (HD) as mean ± SD (n = 3 technical replicates). The results are representative of four independent healthy donors and three independent experiments. (C) BTN2A1 and BTN3A1, A2, and A3 mRNA levels (relative to POLR2A mRNA) were assessed by qRT-PCR in the NLRC5- (red and violet) or mock-transduced Raji subclones (blue). The results depict mean ± SD (n = 3 technical replicates) and are representative of 2 independent experiments. (D) Specific killing of the NLRC5- or mock-transduced Raji subclones was measured after 24 h of co-culture with Vγ9Vδ2 T cells at 3 effector-to-target ratios in the presence of ZOL. n.d. correspond to conditions where no specific lysis of the target cells by the Vγ9Vδ2 T cells was detected. Depicted are the results for three independent healthy donors (HD) as mean ± SD (n = 3 technical replicates). The results are representative of six independent healthy donors and three independent experiments. (A–D) Statistical differences between the condition with and without NLRC5 overexpression were calculated using paired Student's t test (A) or post hoc Student's t tests adjusted for multiple comparisons using the Holm-Sidak method (B–D). ∗p ≤ 0.05, ∗∗p ≤ 0.01, ∗∗∗p ≤ 0.001. Only statistically significant differences are illustrated.

Similar articles

Cited by

  • CRISPR screens decode cancer cell pathways that trigger γδ T cell detection.
    Mamedov MR, Vedova S, Freimer JW, Sahu AD, Ramesh A, Arce MM, Meringa AD, Ota M, Chen PA, Hanspers K, Nguyen VQ, Takeshima KA, Rios AC, Pritchard JK, Kuball J, Sebestyen Z, Adams EJ, Marson A. Mamedov MR, et al. Nature. 2023 Sep;621(7977):188-195. doi: 10.1038/s41586-023-06482-x. Epub 2023 Aug 30. Nature. 2023. PMID: 37648854 Free PMC article.
  • Insight into Cancer Immunity: MHCs, Immune Cells and Commensal Microbiota.
    Wen M, Li Y, Qin X, Qin B, Wang Q. Wen M, et al. Cells. 2023 Jul 18;12(14):1882. doi: 10.3390/cells12141882. Cells. 2023. PMID: 37508545 Free PMC article. Review.
  • EBV latent membrane protein 1 augments γδ T cell cytotoxicity against nasopharyngeal carcinoma by induction of butyrophilin molecules.
    Liu Y, Lui KS, Ye Z, Fung TY, Chen L, Sit PY, Leung CY, Mak NK, Wong KL, Lung HL, Tanaka Y, Cheung AKL. Liu Y, et al. Theranostics. 2023 Jan 1;13(2):458-471. doi: 10.7150/thno.78395. eCollection 2023. Theranostics. 2023. PMID: 36632221 Free PMC article.
  • Cross-cohort analysis of expression and splicing quantitative trait loci in TOPMed.
    Orchard P, Blackwell TW, Kachuri L, Castaldi PJ, Cho MH, Christenson SA, Durda P, Gabriel S, Hersh CP, Huntsman S, Hwang S, Joehanes R, Johnson M, Li X, Lin H, Liu CT, Liu Y, Mak ACY, Manichaikul AW, Paik D, Saferali A, Smith JD, Taylor KD, Tracy RP, Wang J, Wang M, Weinstock JS, Weiss J, Wheeler HE, Zhou Y, Zoellner S, Wu JC, Mestroni L, Graw S, Taylor MRG, Ortega VE, Johnson CW, Gan W, Abecasis G, Nickerson DA, Gupta N, Ardlie K, Woodruff PG, Zheng Y, Bowler RP, Meyers DA, Reiner A, Kooperberg C, Ziv E, Ramachandran VS, Larson MG, Cupples LA, Burchard EG, Silverman EK, Rich SS, Heard-Costa N, Tang H, Rotter JI, Smith AV, Levy D; NHLBI TOPMed Consortium Multi-Omics Working Group; NHLBI TOPMed Consortium; Aguet F, Scott L, Raffield LM, Parker SCJ. Orchard P, et al. medRxiv [Preprint]. 2025 Feb 21:2025.02.19.25322561. doi: 10.1101/2025.02.19.25322561. medRxiv. 2025. PMID: 40034763 Free PMC article. Preprint.
  • Prognostic and Therapeutic Significance of BTN3A Proteins in Tumors.
    Chen S, Li Z, Huang W, Wang Y, Fan S. Chen S, et al. J Cancer. 2021 May 27;12(15):4505-4512. doi: 10.7150/jca.57831. eCollection 2021. J Cancer. 2021. PMID: 34149914 Free PMC article. Review.

References

    1. Abeler-Dorner L., Swamy M., Williams G., Hayday A.C., Bas A. Butyrophilins: an emerging family of immune regulators. Trends Immunol. 2012;33:34–41. - PubMed
    1. Anderson D.A., 3rd, Grajales-Reyes G.E., Satpathy A.T., Vasquez Hueichucura C.E., Murphy T.L., Murphy K.M. Revisiting the specificity of the MHC class II transactivator CIITA in classical murine dendritic cells in vivo. Eur. J. Immunol. 2017;47:1317–1323. - PMC - PubMed
    1. Arnett H.A., Viney J.L. Immune modulation by butyrophilins. Nat. Rev. Immunol. 2014;14:559–569. - PubMed
    1. Bakker A.B., Phillips J.H., Figdor C.G., Lanier L.L. Killer cell inhibitory receptors for MHC class I molecules regulate lysis of melanoma cells mediated by NK cells, gamma delta T cells, and antigen-specific CTL. J. Immunol. 1998;160:5239–5245. - PubMed
    1. Benyamine A., Le Roy A., Mamessier E., Gertner-Dardenne J., Castanier C., Orlanducci F., Pouyet L., Goubard A., Collette Y., Vey N. BTN3A molecules considerably improve Vgamma9Vdelta2T cells-based immunotherapy in acute myeloid leukemia. Oncoimmunology. 2016;5:e1146843. - PMC - PubMed