

Interaction network of immune-associated genes affecting the prognosis of patients with glioblastoma
- PMID: 33365061
- PMCID: PMC7716634
- DOI: 10.3892/etm.2020.9493
Interaction network of immune-associated genes affecting the prognosis of patients with glioblastoma
Abstract
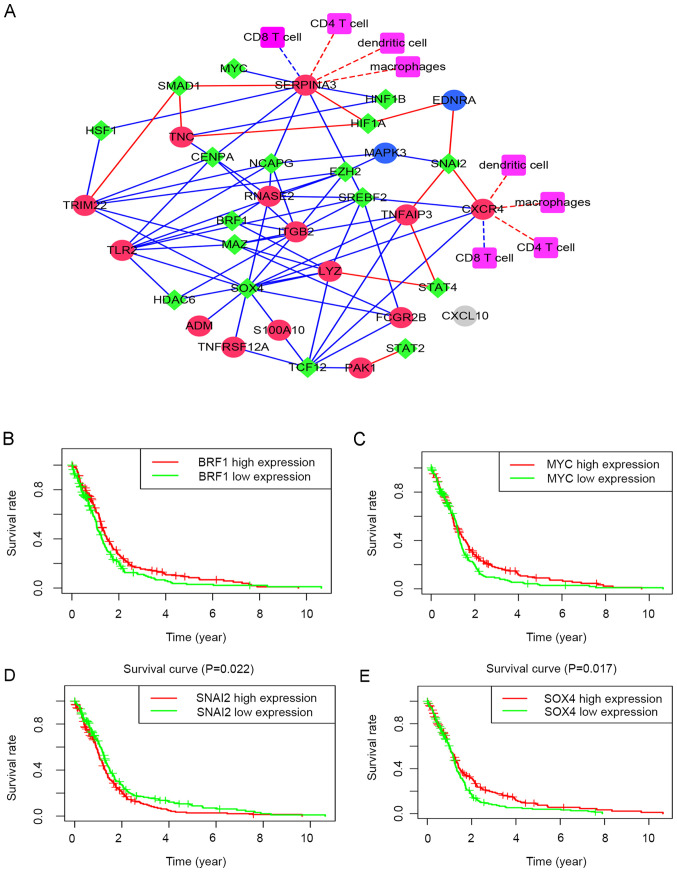
Glioblastoma multiforme (GBM) is a common malignant tumor type of the nervous system. The purpose of the present study was to establish a regulatory network of immune-associated genes affecting the prognosis of patients with GBM. The GSE4290, GSE50161 and GSE2223 datasets from the Gene Expression Omnibus database were screened to identify common differentially expressed genes (co-DEGs). A functional enrichment analysis indicated that the co-DEGs were mainly enriched in cell communication, regulation of enzyme activity, immune response, nervous system, cytokine signaling in immune system and the AKT signaling pathway. The co-DEGs accumulated in immune response were then further investigated. For this, the intersection of those co-DEGs and currently known immune-regulatory genes was obtained and a differential expression analysis of these overlapping immune-associated genes was performed. A risk model was established using immune-regulatory genes that affect the prognosis of patients with GBM. The risk score was significantly associated with the prognosis of patients with GBM and had a significant independent predictive value. The risk model had high accuracy in predicting the prognosis of patients with GBM [area under the receiver operating characteristic curve (AUC)=0.764], which was higher than that of a previously reported model of prognosis-associated biomarkers (AUC=0.667). Furthermore, an interaction network was constructed by using immune-regulatory genes and transcription factors affecting the prognosis of patients with GBM and the University of California Santa Cruz database was used to perform a preliminary analysis of the transcription factors and immune genes of interest. The interaction network of immune-regulatory genes constructed in the present study enhances the current understanding of mechanisms associated with poor prognosis of patients with GBM. The risk score model established in the present study may be used to evaluate the prognosis of patients with GBM.
Keywords: Gene Expression Omnibus; The Cancer Genome Atlas; glioblastoma; immune gene; poor prognosis.
Copyright: © Hou et al.
Figures


Similar articles
-
Bioinformatics analyses of significant genes, related pathways and candidate prognostic biomarkers in glioblastoma.Mol Med Rep. 2018 Nov;18(5):4185-4196. doi: 10.3892/mmr.2018.9411. Epub 2018 Aug 21. Mol Med Rep. 2018. PMID: 30132538 Free PMC article.
-
Integrated Analysis to Evaluate the Prognostic Value of Signature mRNAs in Glioblastoma Multiforme.Front Genet. 2020 Mar 31;11:253. doi: 10.3389/fgene.2020.00253. eCollection 2020. Front Genet. 2020. PMID: 32296458 Free PMC article.
-
A 63 signature genes prediction system is effective for glioblastoma prognosis.Int J Mol Med. 2018 Apr;41(4):2070-2078. doi: 10.3892/ijmm.2018.3422. Epub 2018 Jan 25. Int J Mol Med. 2018. PMID: 29393370 Free PMC article.
-
Bioinformatics analysis of high-throughput data to validate potential novel biomarkers and small molecule drugs for glioblastoma multiforme.J Int Med Res. 2020 Jul;48(7):300060520924541. doi: 10.1177/0300060520924541. J Int Med Res. 2020. PMID: 32634050 Free PMC article.
-
Construction of Potential Glioblastoma Multiforme-Related miRNA-mRNA Regulatory Network.Front Mol Neurosci. 2019 Mar 26;12:66. doi: 10.3389/fnmol.2019.00066. eCollection 2019. Front Mol Neurosci. 2019. PMID: 30971889 Free PMC article.
Cited by
-
Identification, and Experimental and Bioinformatics Validation of an Immune-Related Prognosis Gene Signature for Low-Grade Glioma Based on mRNAsi.Cancers (Basel). 2023 Jun 19;15(12):3238. doi: 10.3390/cancers15123238. Cancers (Basel). 2023. PMID: 37370848 Free PMC article.
-
Identification of an Immune-Related Prognostic Signature for Glioblastoma by Comprehensive Bioinformatics and Experimental Analyses.Cells. 2022 Sep 26;11(19):3000. doi: 10.3390/cells11193000. Cells. 2022. PMID: 36230961 Free PMC article.
-
Immune-related interaction perturbation networks unravel biological peculiars and clinical significance of glioblastoma.Imeta. 2023 Jul 16;2(3):e127. doi: 10.1002/imt2.127. eCollection 2023 Aug. Imeta. 2023. PMID: 38867932 Free PMC article.
References
-
- Stupp R, Hegi ME, Mason WP, van den Bent MJ, Taphoorn MJ, Janzer RC, Ludwin SK, Allgeier A, Fisher B, Belanger K, et al. European Organisation for Research and Treatment of Cancer Brain Tumour and Radiation Oncology Groups; National Cancer Institute of Canada Clinical Trials Group: Effects of radiotherapy with concomitant and adjuvant temozolomide versus radiotherapy alone on survival in glioblastoma in a randomised phase III study: 5-year analysis of the EORTC-NCIC trial. Lancet Oncol. 2009;10:459–466. doi: 10.1016/S1470-2045(09)70025-7. - DOI - PubMed
-
- Cooper LA, Gutman DA, Chisolm C, Appin C, Kong J, Rong Y, Kurc T, Van Meir EG, Saltz JH, Moreno CS, et al. The tumor microenvironment strongly impacts master transcriptional regulators and gene expression class of glioblastoma. Am J Pathol. 2012;180:2108–2119. doi: 10.1016/j.ajpath.2012.01.040. - DOI - PMC - PubMed
LinkOut - more resources
Full Text Sources