. 2020 Dec 17:9:333-350.
doi: 10.2147/ITT.S279228. eCollection 2020.

Acetylcholine Regulates Pulmonary Pathology During Viral Infection and Recovery

Affiliations

Acetylcholine Regulates Pulmonary Pathology During Viral Infection and Recovery

Alexander P Horkowitz et al. Immunotargets Ther. .

Abstract

Introduction: This study was designed to explore the role of acetylcholine (ACh) in pulmonary viral infection and recovery. Inflammatory control is critical to recovery from respiratory viral infection. ACh secreted from non-neuronal sources, including lymphocytes, plays an important, albeit underappreciated, role in regulating immune-mediated inflammation.

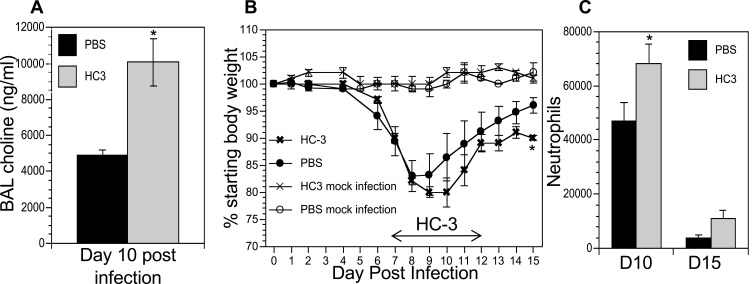
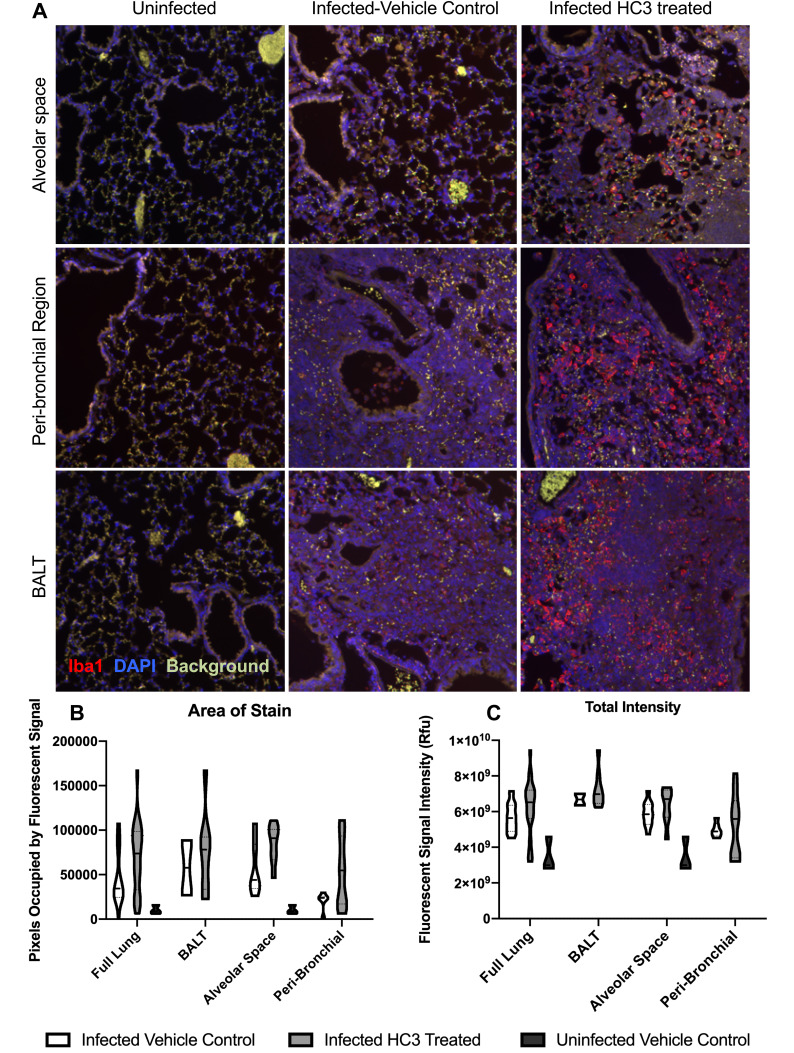
Methods: ACh and lymphocyte cholinergic status in the lungs were measured over the course of influenza infection and recovery. The role of ACh was examined by inhibiting ACh synthesis in vivo. Pulmonary inflammation was monitored by Iba1 immunofluorescence, using a novel automated algorithm. Tissue repair was monitored histologically.

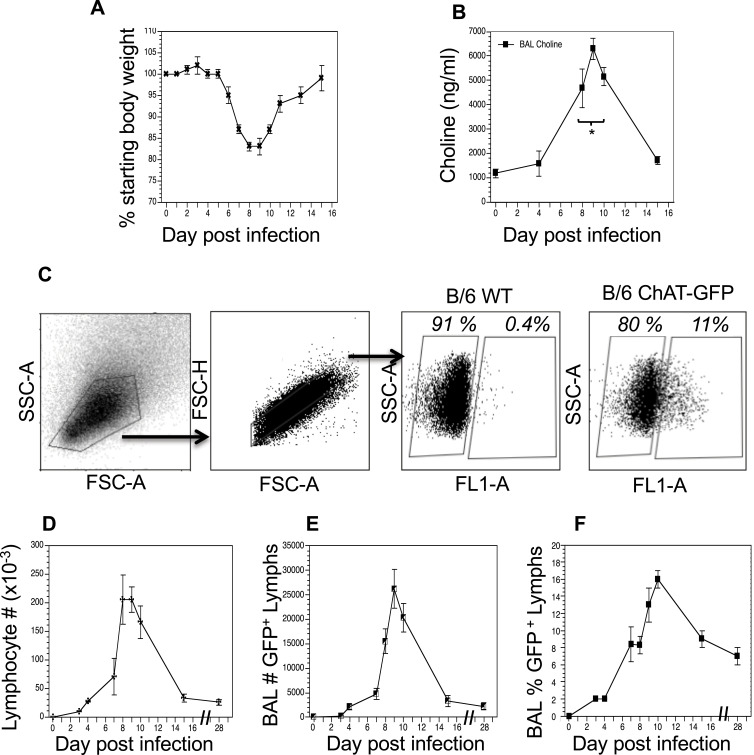
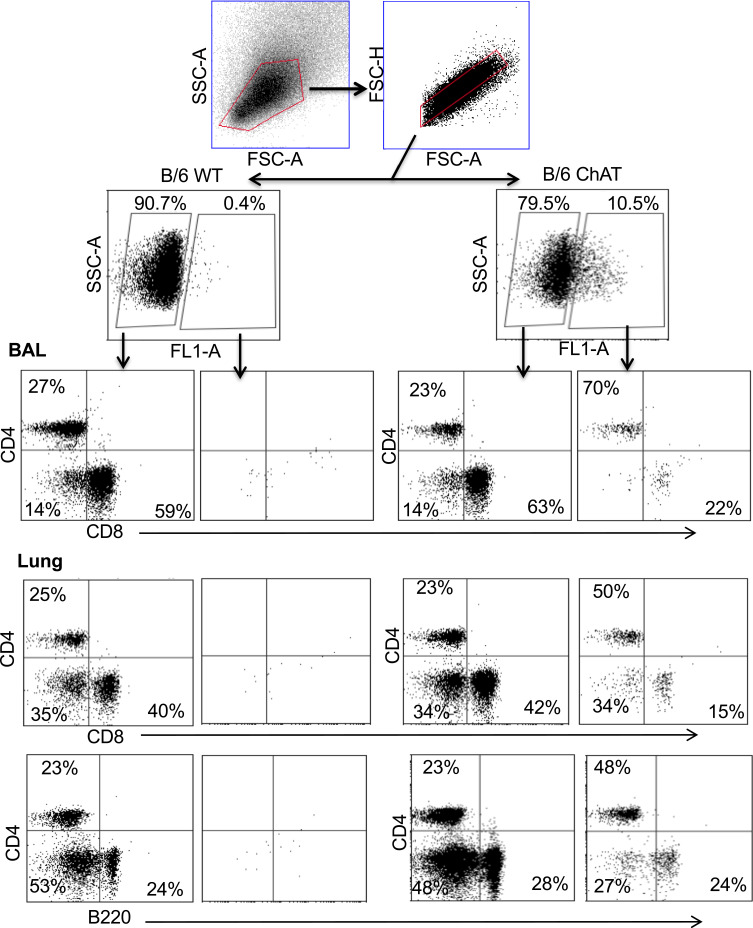
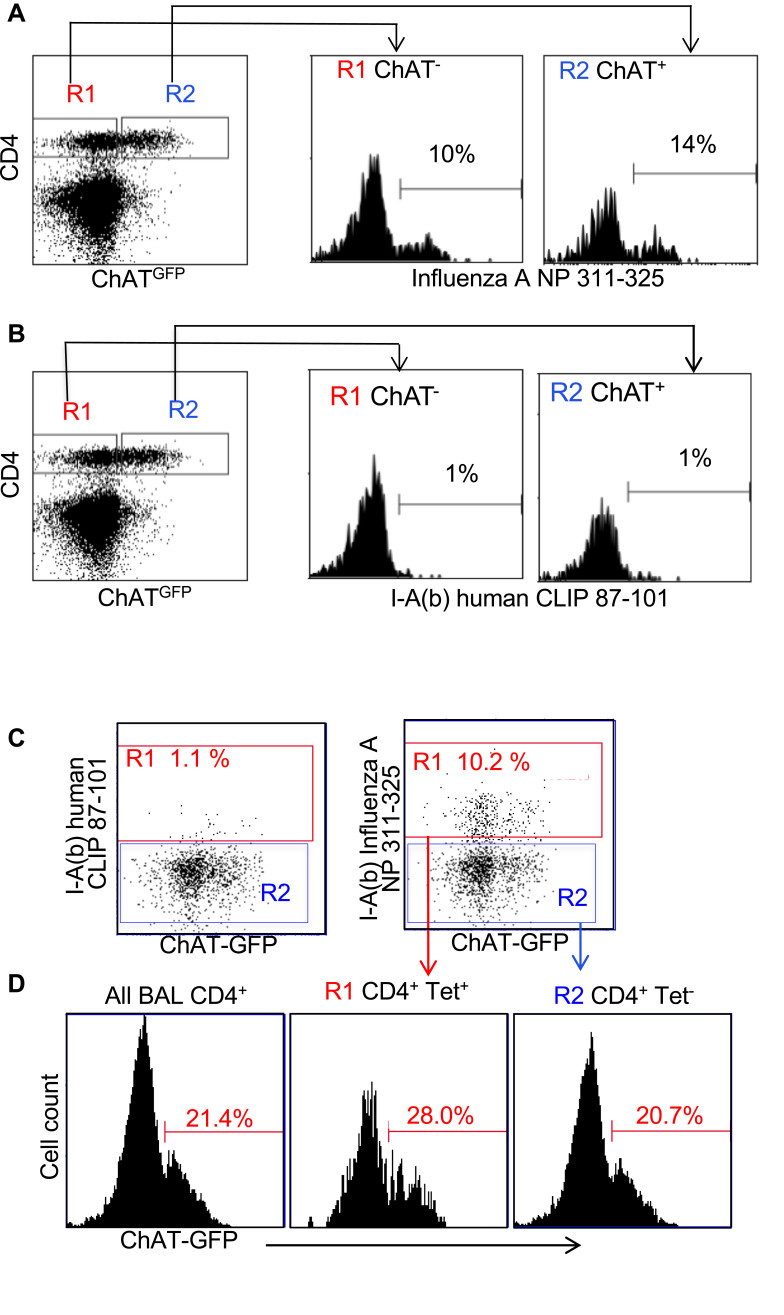
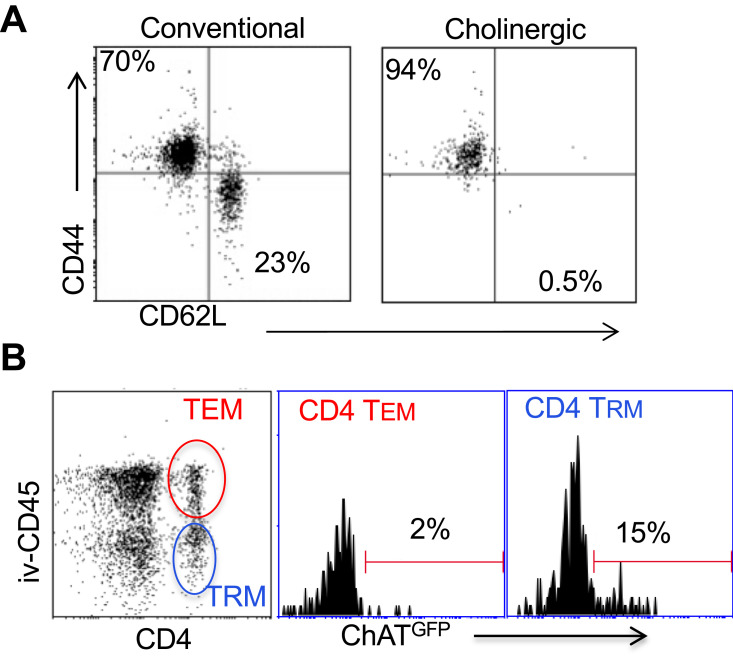
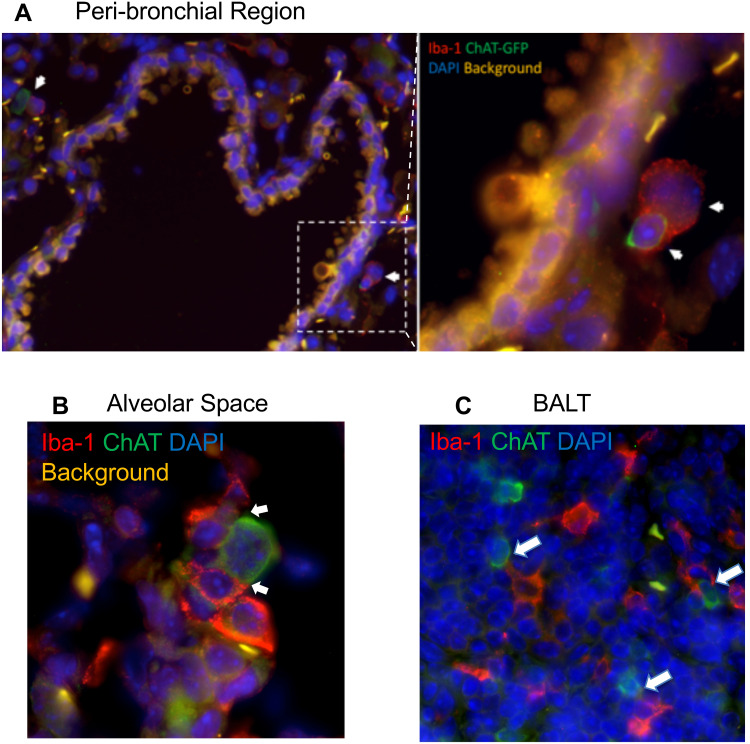
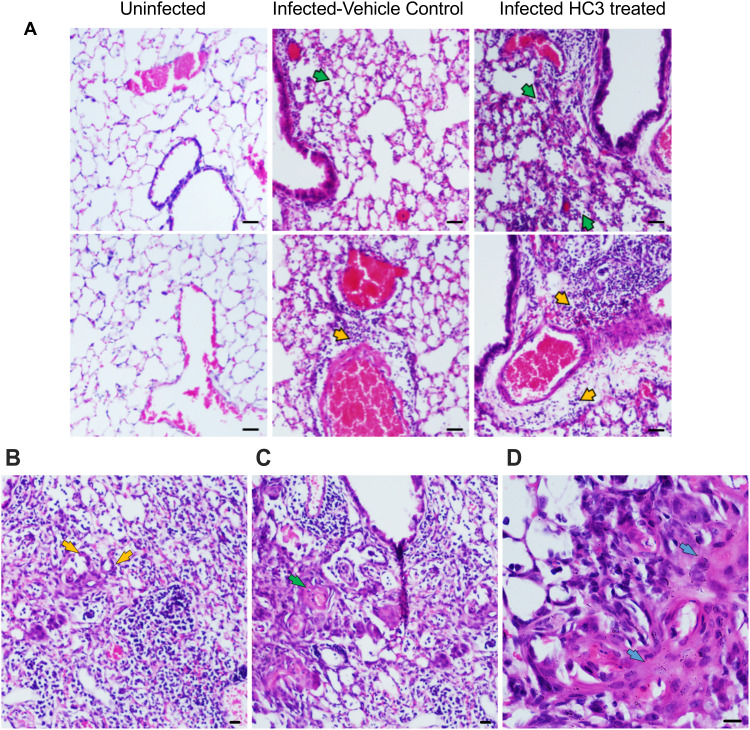
Results: Pulmonary ACh remained constant through the early stage of infection and increased during the peak of the acquired immune response. As the concentration of ACh increased, cholinergic lymphocytes appeared in the BAL and lungs. Cholinergic capacity was found primarily in CD4 T cells, but also in B cells and CD8 T cells. The cholinergic CD4+ T cells bound to influenza-specific tetramers and were retained in the resident memory regions of the lung up to 2 months after infection. Histologically, cholinergic lymphocytes were found in direct physical contact with activated macrophages throughout the lung. Inflammation was monitored by ionized calcium-binding adapter molecule 1 (Iba1) immunofluorescence, using a novel automated algorithm. When ACh production was inhibited, mice exhibited increased tissue inflammation and delayed recovery. Histologic examination revealed abnormal tissue repair when ACh was limited.

Conclusion: These findings point to a previously unrecognized role for ACh in the transition from active immunity to recovery and pulmonary repair following respiratory viral infection.

Keywords: Aif-1; CD4 resident memory; ChAT; Iba1; MATLAB; acetylcholine; acetylcholinesterase; automated algorithm; cholinergic anti-inflammatory pathway; cholinergic lymphocytes; inflammaging; inflammation; influenza; pulmonary repair.


Conflict of interest statement

This study was supported by NIH AI119929 (JP), San Diego State University Bridge Funding (JP), and San Diego State University Initiative for Maximizing Student Development Award GM058906 (CA). The funders had no role in study design, data collection and analysis, decision to publish, or preparation of the manuscript. The authors report no conflicts of interest in this work.

Figures

Figure 1
Figure 1
Cholinergic changes kinetics in the influenza-infected lung. Mice were infected with a non-lethal dose of influenza A PR/8 as described in the Materials and Methods section and were weighed daily starting the day of infection. (A) Weight change following influenza infection. Group average weight change is shown as mean ± SEM. (B) Airway choline concentration was measured using HILIC LC–MS/MS with a stable choline-d4 isotope-labeled internal standard as described in the Materials and Methods section. *Difference in airway choline concentration reaches statistical significance (p < 0.005, BFUB > 50) on days 8–10 post infection. (C) Ten days after infection, airway cells were isolated by lung lavage, stained with fluorescent antibodies and analyzed as described in the Materials and Methods section. Gating strategy for BAL cell analysis is shown using wild-type C57Bl/6 mouse as a negative control for GFP fluorescence. Representative day 10 staining data are shown (30 mice); compiled data are found in Table 1. FSC: forward scatter (size); SSC: side scatter. Cholinergic capacity was defined as positive FL1+ fluorescence compared to wild-type C57Bl/6. (D) Kinetics of total airway lymphocytes; (E) Kinetics of airway cholinergic (GFP+) cells; (F) Percentage of all lymphocytes expressing GFP over the course of influenza infection.
Figure 2
Figure 2
Airway and lung cholinergic cell phenotyping. Animals were infected with influenza as in Figure 1 and sacrificed 10 days later for analysis. Cells were isolated and stained for surface marker analysis as described in the Materials and Methods section. Gating strategy to examine surface phenotypes of FL-1+ (ChAT-GFP+) and FL-1 (ChAT-GFP) cells is shown. Representative staining data are shown (10–30 mice per time point), compiled data are found in Table 1.
Figure 3
Figure 3
Cholinergic CD4 T bind to influenza-specific tetramers. Mice were infected with influenza A/PR8 and sacrificed for analysis 8 days later. BAL cells were isolated and stained for CD4 as in Figure 2. Cells were then stained with either the class II tetramer I-A(b) Influenza A NP 311–325 (A) or the negative control tetramer I-A(b) human CLIP 87–101 (B) as described in the Materials and Methods section. Histograms show staining of R1 = conventional CD4 T cells; R2 = cholinergic CD4 T cells vs ChAT-GFP fluorescence. (C) Gated CD4 T cells were stained for either the negative control tetramer I-A(b) human CLIP 87–101 or the class II tetramer I-A(b) Influenza A NP 311–325, and analyzed for tetramer binding vs ChAT-GFP expression. R1 = tetramer+ CD4 T cells; R2 = tetramer CD4 T cells. (D) Histograms show GFP expression in R1 tetramer+ and R2 tetramer CD4T cells.
Figure 4
Figure 4
Cholinergic CD4 T cells reside in the resident memory niche of the lung. Two months after influenza infection, mice were injected intravenously with fluorescent anti-CD45 10 minutes before sacrifice. Lung lymphocytes were stained for surface markers and analyzed based on GFP expression as in Figures 1 and 2. (A) Gated CD4 cells were stained for memory markers CD44 and CD52L. (B) Total lymphocytes from ChAT-GFP mice were analyzed based on fluorescence of the injected CD45 antibody vs CD4 expression. CD4+CD45+ (TEM) and CD4+CD45 (TRM) were then analyzed for GFP expression.
Figure 5
Figure 5
Cholinergic lymphocytes can be found in direct contact with activated macrophages throughout the lung. Animals were infected with influenza A as in Figure 1 and sacrificed for analysis 12 days later. Lungs were processed for immunofluorescent staining as described in the Materials and Methods section. Dual-labeled sections (Green: ChAT-GFP, Red: Iba1) of infected lungs show close contact of cholinergic lymphocytes (ChAT-GFP+) and activated macrophages (Iba1+). White arrows identify areas of contact between Iba1+ inflammatory cells and cholinergic lymphocytes. (A) Peri-bronchial region: left image taken at 20× with 0.5 digital zoom, enlarged inset image taken at 63× under oil immersion with 1.4 digital zoom. (B) Alveolar Space; image taken at 63× under oil immersion with 1.4 digital zoom. (C) BALT; image taken at 20× under oil immersion with 1.3 digital zoom.
Figure 6
Figure 6
Decreasing ACh synthesis delays recovery and increases inflammation following influenza infection. Mice were infected with influenza and injected with HC3 or PBS 7–12 dpi as described in the Materials and Methods section. Mock infection controls were insufflated with PBS at the time of infection. (A) Airway choline was measured 10 days after infection as in Figure 1. *Difference in airway choline concentration was statistically significant (p < 0.05, BFUB > 6). (B) Weight was measured daily throughout infection and recovery as in Figure 1. Control cohorts were injected with either HC3 or PBS but were not infected with influenza. Group average weight changes are shown as mean ± SEM. Representative data of five separate experiments, using a total of 128 influenza-infected mice. *Difference in weight is statistically significant (p < 0.05; BFUB > 5.5) on d15 after infection. (C) On days 10 and 15 after infection, pulmonary neutrophils (SSChiCD11b+Ly6G/1A8+) in the influenza-infected cohorts were identified by FACS analysis. *Difference in airway neutrophils is statistically significant (p < 0.05, BFUB > 2)on day 10 after infection.
Figure 7
Figure 7
IHC Analysis of Iba1 During Recovery. Animals were infected and treated with HC3 or PBS as above and sacrificed for analysis 15 days later. Lungs were processed for immunofluorescent staining as described in the Materials and Methods section. (A) Immunofluorescence of Iba1 staining in multiple lung regions. Representative images taken at 20× showing Iba1 staining (red, AlexaFluor-594) and DAPI stained nuclei (blue) in the alveolar space, peri-bronchial region, and BALT in uninfected, infected vehicle control, and infected drug-treated animals 15dpi. (B) Quantification of Iba1 fluorescence, using a novel automated image segmentation algorithm as described in the Materials and Methods section. Area of stain was greater in infected HC3-treated lung compared to infected vehicle control lung (p < 0.01, BFUB > 6), and in the airways (p < 0.05, BFUL > 4) and peri-airway (p < 0.05, BFUB > 2.75) regions of the lung. (C) Total intensity analysis identified greater average intensity of fluorescent signal in the lungs of infected HC3-treated groups compared to infected vehicle control groups in the alveolar space and peri-bronchial regions, as well as the full lung. For (B) and (C), violin plots were used to visualize the full distribution of the data and to determine if the data distribution was multimodal. In brief, the width of the plot reflects the probability density of the data at those values.
Figure 8
Figure 8
Histological Analysis of Recovery. (A) Representative images of H&E-stained sections of lung tissue at 10× (scale bar 100µm) magnification from healthy animals, infected vehicle control animals, and infected HC3-treated animals (d15 post infection) from left to right. Lungs from influenza-infected control animals display mild/moderate multifocal perivascular mixed infiltrate (yellow arrow) and alveolar/interstitial mixed infiltrate of lymphocytes and neutrophils (green arrow). Influenza-infected animals treated with HC3 show moderate perivascular (yellow arrow) as well as alveolar/interstitial mixed infiltrate of lymphocytes and neutrophils (green arrow). (BD) Infected HC3-treated lung tissue exhibit multifocal type 2 pneumocyte proliferation (yellow arrow), mild multifocal squamous cell metaplasia (green arrow), and mild fibroplasia (blue arrow).

References

    1. Kawashima K, Oohata H, Fujimoto K, Suzuki T. Plasma concentration of acetylcholine in young women. Neurosci Lett. 1987;80(3):339–342. doi:10.1016/0304-3940(87)90478-2 - DOI - PubMed
    1. Kawashima K, Oohata H, Fujimoto K, Suzuki T. Extraneuronal localization of acetylcholine and its release upon nicotinic stimulation in rabbits. Neurosci Lett. 1989;104(3):336–339. doi:10.1016/0304-3940(89)90599-5 - DOI - PubMed
    1. Fujii T, Yamada S, Yamaguchi N, Fujimoto K, Suzuki T, Kawashima K. Species differences in the concentration of acetylcholine, a neurotransmitter, in whole blood and plasma. Neurosci Lett. 1995;201(3):207–210. doi:10.1016/0304-3940(95)12180-3 - DOI - PubMed
    1. Fujii T, Tsuchiya T, Yamada S, et al. Localization and synthesis of acetylcholine in human leukemic T cell lines. J Neurosci Res. 1996;44(1):66–72. - PubMed
    1. Kawashima K, Fujii T, Moriwaki Y, Misawa H, Horiguchi K. Non-neuronal cholinergic system in regulation of immune function with a focus on alpha7 nAChRs. Int Immunopharmacol. 2015;29(1):127–134. - PubMed