. 2020 Dec 7:8:617545.
doi: 10.3389/fcell.2020.617545. eCollection 2020.

Cohesin Components Stag1 and Stag2 Differentially Influence Haematopoietic Mesoderm Development in Zebrafish Embryos

Affiliations

Cohesin Components Stag1 and Stag2 Differentially Influence Haematopoietic Mesoderm Development in Zebrafish Embryos

Sarada Ketharnathan et al. Front Cell Dev Biol. .

Abstract

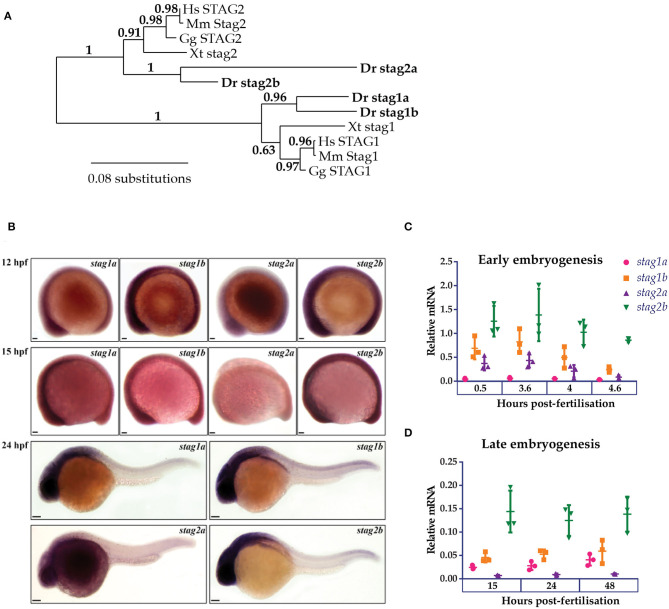
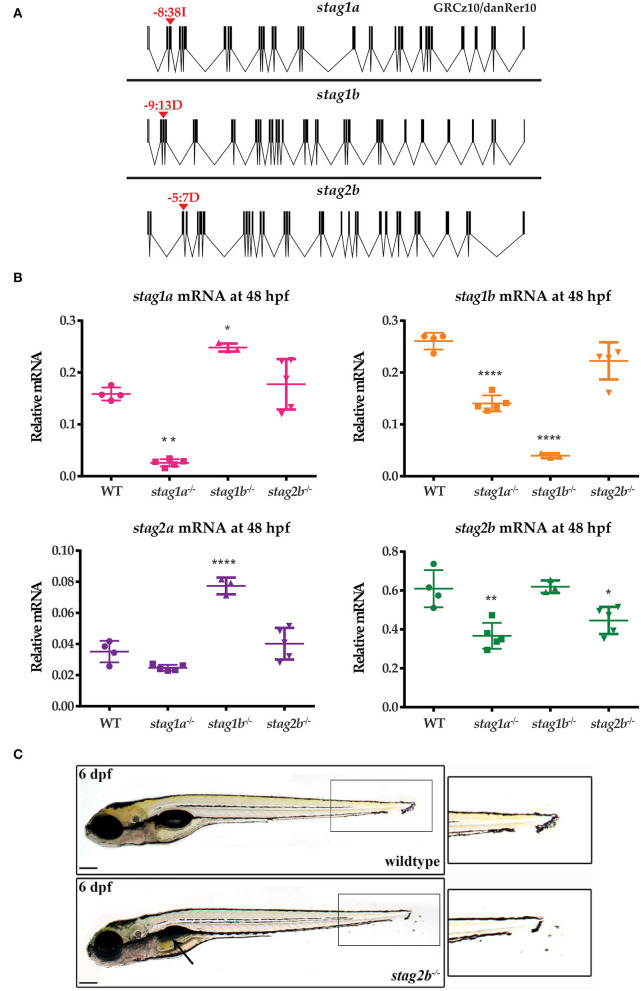
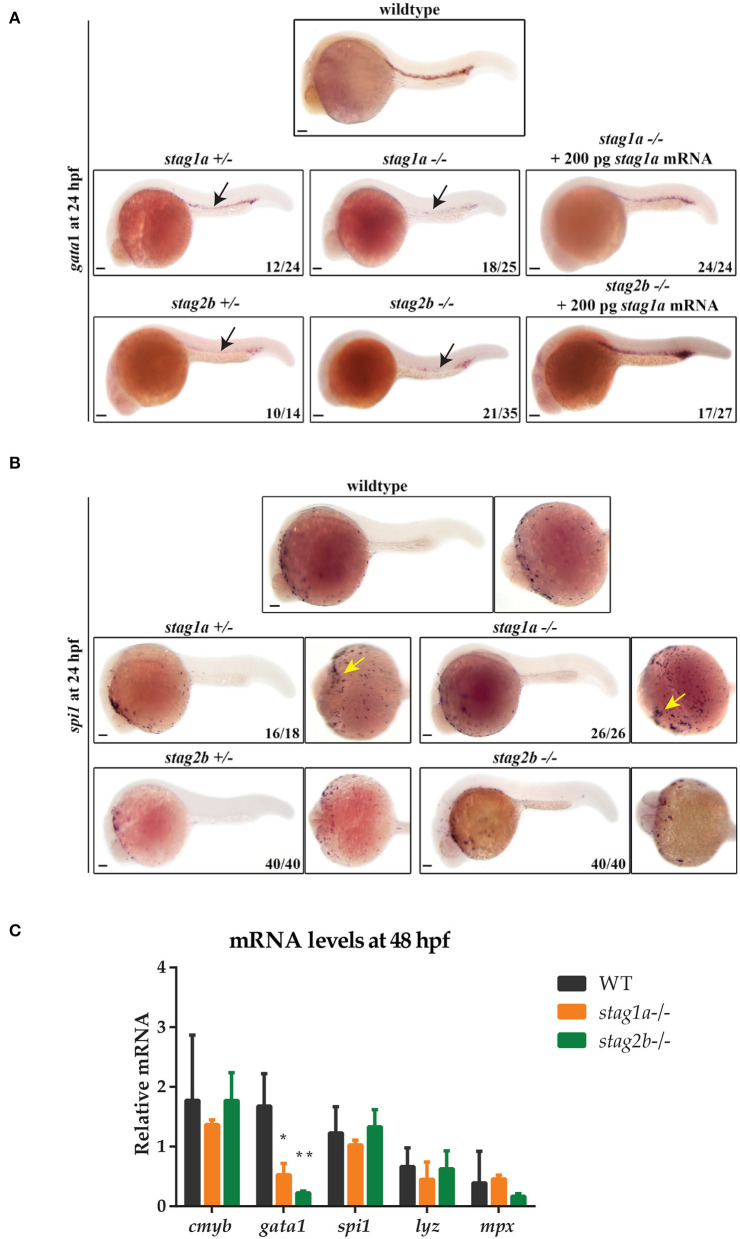
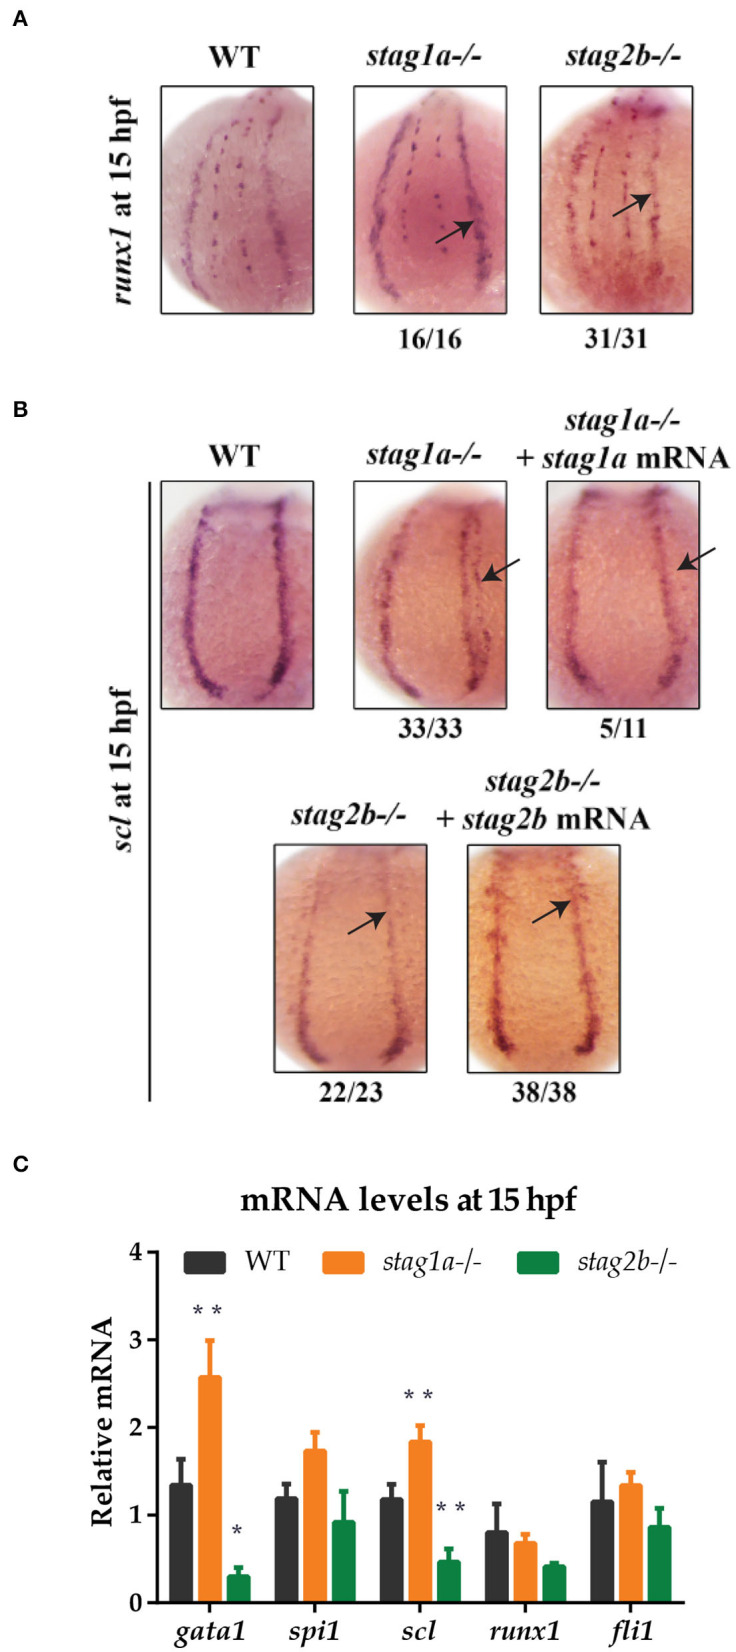
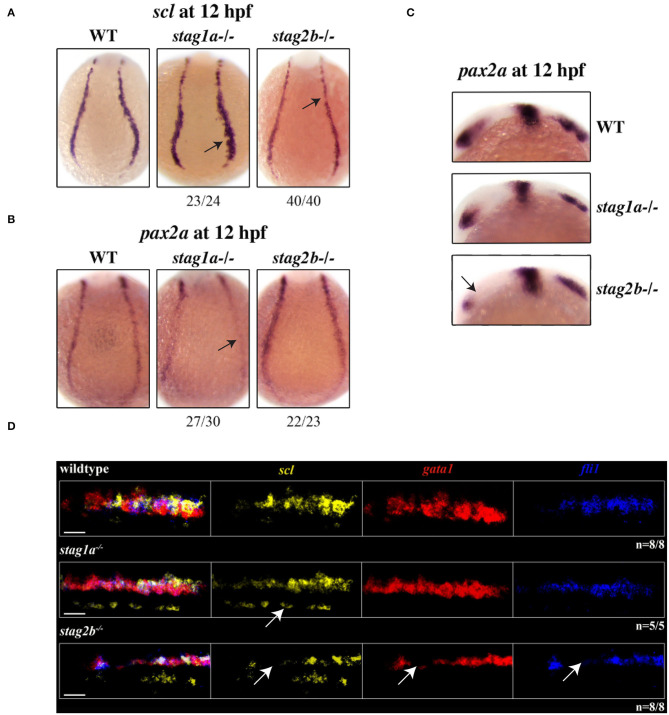
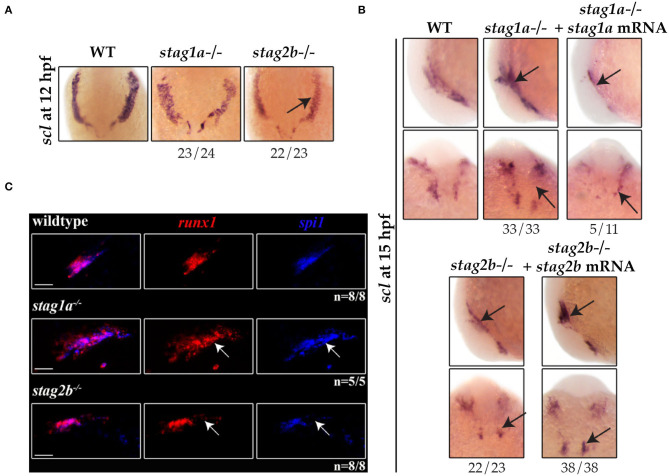
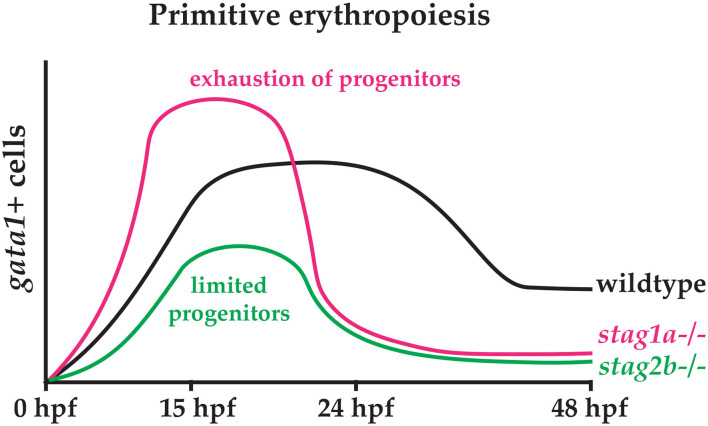
Cohesin is a multiprotein complex made up of core subunits Smc1, Smc3, and Rad21, and either Stag1 or Stag2. Normal haematopoietic development relies on crucial functions of cohesin in cell division and regulation of gene expression via three-dimensional chromatin organization. Cohesin subunit STAG2 is frequently mutated in myeloid malignancies, but the individual contributions of Stag variants to haematopoiesis or malignancy are not fully understood. Zebrafish have four Stag paralogues (Stag1a, Stag1b, Stag2a, and Stag2b), allowing detailed genetic dissection of the contribution of Stag1-cohesin and Stag2-cohesin to development. Here we characterize for the first time the expression patterns and functions of zebrafish stag genes during embryogenesis. Using loss-of-function CRISPR-Cas9 zebrafish mutants, we show that stag1a and stag2b contribute to primitive embryonic haematopoiesis. Both stag1a and stag2b mutants present with erythropenia by 24 h post-fertilization. Homozygous loss of either paralogue alters the number of haematopoietic/vascular progenitors in the lateral plate mesoderm. The lateral plate mesoderm zone of scl-positive cells is expanded in stag1a mutants with concomitant loss of kidney progenitors, and the number of spi1-positive cells are increased, consistent with skewing toward primitive myelopoiesis. In contrast, stag2b mutants have reduced haematopoietic/vascular mesoderm and downregulation of primitive erythropoiesis. Our results suggest that Stag1 and Stag2 proteins cooperate to balance the production of primitive haematopoietic/vascular progenitors from mesoderm.

Keywords: STAG1; STAG2; cohesin; development; haematopoiesis; mesoderm; zebrafish.


Conflict of interest statement

The authors declare that the research was conducted in the absence of any commercial or financial relationships that could be construed as a potential conflict of interest.

Figures

Figure 1
Figure 1
Phylogenetic analysis and embryonic expression of Stag paralogues. (A) Phylogenetic analysis of predicted protein sequences using the maximum likelihood approach. The accession numbers for the protein sequences used in this analysis are listed in Supplementary Table 1. (B) Whole-mount in situ hybridization of stag1a, stag1b, stag2a, and stag2b during early embryogenesis. Lateral views are shown, anterior to the left. Scale bars are 50 μm for embryos at 12 and 15 hpf and 100 μm for embryos at 24 hpf. (C,D) mRNA expression of stag paralogues at the indicated time points during (C) early embryogenesis and (D) late embryogenesis. Each data point represents mRNA isolated from a pool of 30 embryos. Graphs are mean +/- one standard deviation. Expression was normalized to the reference genes, b-actin and rpl13a (Supplementary Figure 1A).
Figure 2
Figure 2
Generation of zebrafish stag germline mutants. CRISPR-Cas9 genome editing was used to generate germline mutations in stag1a, stag1b, and stag2b. (A) Exon diagrams of the respective paralogues showing details of the editing strategy. sgRNA binding sites are marked by red arrowheads with the type of mutation generated indicated above. (B) mRNA levels of the four paralogues in each of the mutant lines indicated on the x-axis. Each data point represents mRNA isolated from a pool of 30 embryos. All graphs are mean +/- one standard deviation. *P ≤ 0.05, **P ≤ 0.01, and ****P ≤ 0.0001; one-way ANOVA. Expression was normalized to the reference gene, b-actin (Supplementary Figure 1C) (C) stag2bnz207 mutants have displaced pigment cells in the tail fin, zoom-ins are shown in insets. Mutants also show mild developmental delay with late swim bladder inflation as indicated by the black arrow. Scale bars are 200 μm.
Figure 3
Figure 3
Stag mutations alter the number of gata1- and spi1-positive cells in 24 hpf zebrafish embryos. (A) Lateral views of gata1 expression in whole-mount embryos at 24 hpf; anterior to the left. gata1 expression is reduced in stag1anz204+/- and stag1a nz204-/- embryos and is rescued upon injection of functional stag1a mRNA. gata1 expression is reduced in stag2b nz207+/- and stag2b nz207-/- embryos and is rescued upon injection of functional stag2b mRNA. Reduced expression is indicated by arrows. (B) spi1 expression in whole-mount embryos at 24 hpf. Left panels show lateral views and right panels show ventral views; anterior to the left. The number of spi1-positive cells is increased in stag1anz204+/- and stag1a nz204-/- embryos (yellow arrows). spi1 expression in stag2b nz207 heterozygous embryos and stag2b nz207 homozygous mutant embryos is comparable to wildtype. Scale bars are 100 μm. The number of embryos is indicated in lower-right-hand corners. (C) mRNA levels of haematopoietic stem cell marker cmyb and erythroid or myeloid lineage markers in stag1a nz204 and stag2b nz207 homozygous mutant embryos at 48 hpf. The bar graph shows the mean +/- one standard deviation. *P ≤ 0.05, **P ≤ 0.01; one-way ANOVA. Expression was normalized to the reference gene, b-actin.
Figure 4
Figure 4
stag1a and stag2b mutations alter the number of scl-positive cells in the posterior lateral mesoderm at 15 hpf. (A) runx1 expression in whole-mount embryos at 15 hpf. Posterior views of the PLM are shown; dorsal to the top. In stag1anz204 homozygous mutant embryos, runx1 expression is slightly increased. In stag2bnz207 homozygous mutant embryos, runx1 expression is slightly reduced. Changes in expression are marked by arrows and the number of embryos is indicated below each panel. (B) scl expression in whole-mount embryos at 15 hpf. Posterior views of the PLM are shown; dorsal to the top. In stag1anz204 homozygous mutant embryos, expanded expression of scl laterally into the PLM is dampened upon injection of functional stag1a mRNA. In stag2bnz207 homozygous mutant embryos, scl expression is reduced in the anterior PLM and is rescued upon injection of functional stag2b mRNA. Changes in expression are marked by arrows and the number of embryos is indicated below each panel. (C) mRNA levels of mesoderm-derived haematopoietic and endothelial markers at 15 hpf. The bar graph shows the mean +/- one standard deviation. *P ≤ 0.05, **P ≤ 0.01; one-way ANOVA. Expression was normalized to the reference genes, b-actin and rpl13a (Supplementary Figure 1B).
Figure 5
Figure 5
stag1a and stag2b mutations affect cell identity in the posterior lateral mesoderm at 12 hpf. (A) scl expression in whole-mount embryos at 12 hpf, posterior views of the PLM; dorsal to the top. In stag1anz204 homozygous mutant embryos scl expression is expanded. In stag2bnz207 homozygous mutant embryos, scl expression is reduced. Changes in expression are marked by arrows and the number of embryos is indicated below each panel. (B) pax2 expression in whole-mount embryos at 12 hpf, posterior views of the PLM; dorsal to the top. In stag1anz204 homozygous mutant embryos, pax2 expression in the PLM is markedly reduced. In stag2bnz207 homozygous mutant embryos, pax2 expression is comparable to wild type. Changes in expression are marked by arrows and the number of embryos is indicated below each panel. (C) pax2 expression in whole-mount embryos at 12 hpf, lateral views of the head region; anterior to the left. Anterior pax2 expression is specifically reduced in the optic stalk of stag2bnz207 homozygous mutant embryos. (D) Multiplexed in situ HCR of scl (Alexa Fluor 488, false color yellow), gata1 (Alexa Fluor 594, false color red), and fli1 (Alexa Fluor 647, false color blue) expression at 15 hpf. High magnification maximum intensity projections of a single PLM stripe; posterior views with anterior to the left. Expression domains of scl broadly overlap gata1 and fli1 in all embryos. Ectopic scl expression, indicated by white arrow, in stag1anz204 homozygous mutant embryos does not overlap gata1 or fli1 expression domains. In stag2bnz207 homozygous mutant embryos, expression of all three markers is reduced. Scale bars are 10 μm. The number of embryos analyzed is indicated below the respective panels.
Figure 6
Figure 6
stag1a and stag2b mutations differentially alter the production of primitive myeloid cells in the anterior lateral mesoderm at 12 hpf. (A) scl expression in whole-mount embryos at 12 hpf. Ventral views of ALM are shown; dorsal to the top. scl expression is comparable to wildtype in stag1anz204 homozygous mutant embryos and reduced in stag2bnz207 homozygous mutant embryos. (B) scl expression in whole-mount embryos at 15 hpf. Top panels show lateral views and bottom panels show ventral views of the ALM. Expanded scl expression in the ALM of stag1anz204 mutants is rescued upon injection of functional stag1a mRNA. The reduced scl expression in the ALM of stag2bnz207 mutants is rescued upon injection of functional stag2b mRNA. Changes in expression are marked by arrows and the number of embryos is indicated below each panel. (C) Multiplexed in situ HCR of runx1 and spi1 at 15 hpf. Maximum intensity projections of a single ALM stripe; lateral views with dorsal to the top. Expression domains of runx1 (Alexa Fluor 647) and spi1 (Alexa Fluor 514, false color blue) broadly overlap in all embryos. Both runx1 and spi1 are expanded in stag1anz204 embryos but reduced in stag2bnz207 embryos. Changes in expression are indicated by white arrows. Scale bars are 10 μm. The number of embryos analyzed is indicated below the respective panels.
Figure 7
Figure 7
Hypothetical model explaining the effects of Stag1a and Stag2b loss on primitive erythropoiesis. In stag1anz204 mutants, an expansion of early haematopoietic progenitors driven by increased scl expression may lead to precocious differentiation that exhausts the progenitor pool. In stag2bnz207 mutants, a limited pool of haematopoietic progenitors resulting from reduced scl expression leads to a reduction in primitive erythropoiesis.

References

    1. Antony J., Gimenez G., Taylor T., Khatoon U., Day R., Morison I. M., et al. (2020). BET inhibition prevents aberrant RUNX1 and ERG transcription in STAG2 mutant leukaemia cells. J. Mol. Cell Biol. 12, 397–399. 10.1093/jmcb/mjz114 - DOI - PMC - PubMed
    1. Avagliano L., Grazioli P., Mariani M., Bulfamante G. P., Selicorni A., Massa V. (2017). Integrating molecular and structural findings: Wnt as a possible actor in shaping cognitive impairment in Cornelia de lange syndrome. Orphanet J. Rare Dis. 12:174 10.1186/s13023-017-0723-0 - DOI - PMC - PubMed
    1. Berman J. N., Kanki J. P., Look A. T. (2005). Zebrafish as a model for myelopoiesis during embryogenesis. Exp. Hematol. 33, 997–1006. 10.1016/j.exphem.2005.06.010 - DOI - PubMed
    1. Bolte S., Cordelières F. P. (2006). A guided tour into subcellular colocalization analysis in light microscopy. J. Microsc. 224, 213–232. 10.1111/j.1365-2818.2006.01706.x - DOI - PubMed
    1. Bonora G., Plath K., Denholtz M. (2014). A mechanistic link between gene regulation and genome architecture in mammalian development. Curr. Opin. Genet. Dev. 27, 92–101. 10.1016/j.gde.2014.05.002 - DOI - PMC - PubMed