Is a Higher Protein-Lower Glycemic Index Diet More Nutritious Than a Conventional Diet? A PREVIEW Sub-study
- PMID: 33365325
- PMCID: PMC7750310
- DOI: 10.3389/fnut.2020.603801
Is a Higher Protein-Lower Glycemic Index Diet More Nutritious Than a Conventional Diet? A PREVIEW Sub-study
Abstract
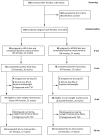
High protein diets and low glycemic index (GI) diets have been associated with improved diet quality. We compared the changes in nutrient intakes of individuals at high risk of developing type-2 diabetes over 3 y who followed either a higher protein-lower GI diet (HPLG) or a conventional moderate protein-moderate GI diet (MPMG). This post hoc analysis included 161 participants with overweight and pre-diabetes from the Australian cohort of the PREVIEW study (clinical trial registered in https://www.clinicaltrials.gov/ct2/show/NCT01777893?term=NCT01777893&draw=2&rank=1) who were randomly assigned to a HPLG diet (25% energy from protein, dietary GI ≤ 50, n = 85) or a MPMG diet (15% energy from protein, dietary GI ≥ 56, n = 76). Food records were collected at 0-mo (baseline) and at 6-, 12-, 24-, and 36-mo (dietary intervention period). Linear mixed models were used to compare the differences in total energy, macro- and micronutrients, dietary GI, glycemic load (GL) and body weight between the two diet groups at the 4 dietary intervention time points. At 3 y, 74% participants from the HPLG diet and 74% participants from the MPMG diet completed the trial. The HPLG group showed significantly higher protein intake and lower dietary GI and GL than the MPMG group (group fixed effect P < 0.001 for all three parameters). By 6-, 12-, 24-, and 36-mo there was a 3.0, 2.7, 2.2, and 1.4% point difference in protein intake and 6.2, 4.1, 4.8, and 3.9 GI unit difference between the groups. The intake of energy and saturated fat decreased (mostly in the first 6-mo), while the intake of dietary fiber increased (from mo-0 to mo-12 only) in both diets, with no significant differences between the diets. The dietary intakes of zinc (group fixed effect P = 0.05), selenium (P = 0.01), niacin (P = 0.01), vitamin B12 (P = 0.01) and dietary cholesterol (group by time fixed effect P = 0.001) were higher in the HPLG group than in the MPMG group. Despite both diets being designed to be nutritionally complete, a HPLG diet was found to be more nutritious in relation to some micronutrients, but not cholesterol, than a MPMG diet.
Keywords: dietary cholesterol; dietary fiber; niacin; pre-diabetes; selenium; vitamin B12; zinc.
Copyright © 2020 Meroni, Muirhead, Atkinson, Fogelholm, Raben and Brand-Miller.
Conflict of interest statement
FA and JB-M manage The University of Sydney's glycemic index testing service and are directors of the Glycemic Index Foundation, a not-for-profit health promotion charity. JB-M is an author of books in The New Glucose Revolution series (De Capo, Cambridge, MA). The remaining authors declare that the research was conducted in the absence of any commercial or financial relationships that could be construed as a potential conflict of interest.
Figures


References
-
- Roglic G. World Health Organization. Global Report on Diabetes. Geneva: World Health Organization; (2016). 86 p.
-
- Jensen MD, Ryan DH, Apovian CM, Ard JD, Comuzzie AG, Donato KA, et al. 2013 AHA/ACC/TOS guideline for the management of overweight and obesity in adults: a report of the American College of Cardiology/American Heart Association Task Force on Practice Guidelines and The Obesity Society. J Am Coll Cardiol. (2014) 63(25 Pt B):2985–3023. 10.1016/j.jacc.2013.11.004 - DOI - PubMed
Associated data
LinkOut - more resources
Full Text Sources
Medical

