. 2020 Dec 7:7:582297.
doi: 10.3389/fvets.2020.582297. eCollection 2020.

Survey and Sequence Characterization of Bovine Mastitis-Associated Escherichia coli in Dairy Herds

Affiliations

Survey and Sequence Characterization of Bovine Mastitis-Associated Escherichia coli in Dairy Herds

John I Alawneh et al. Front Vet Sci. .

Abstract

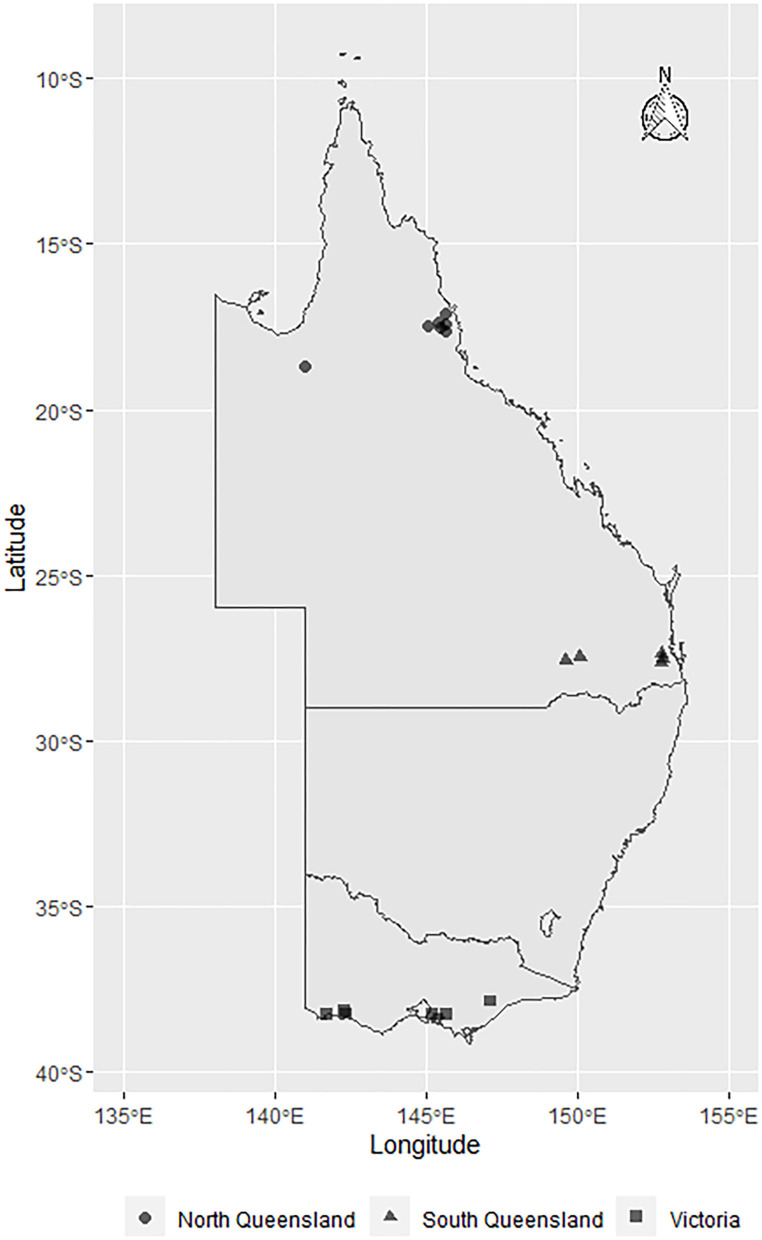
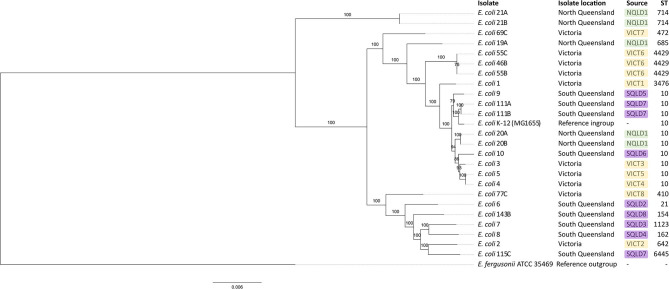
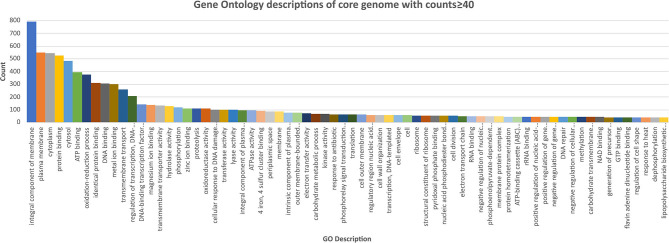
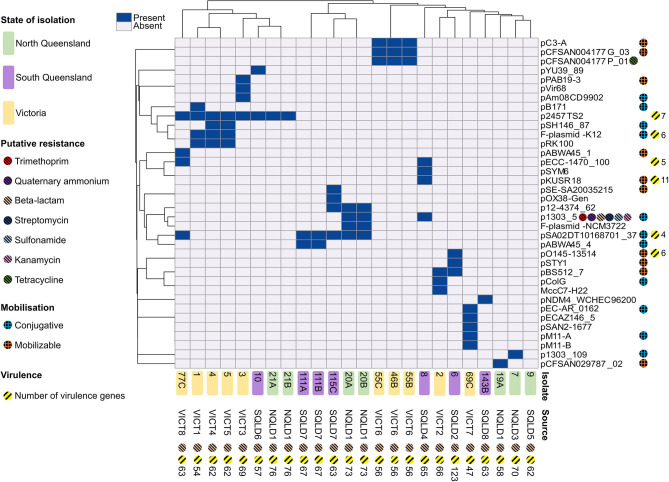
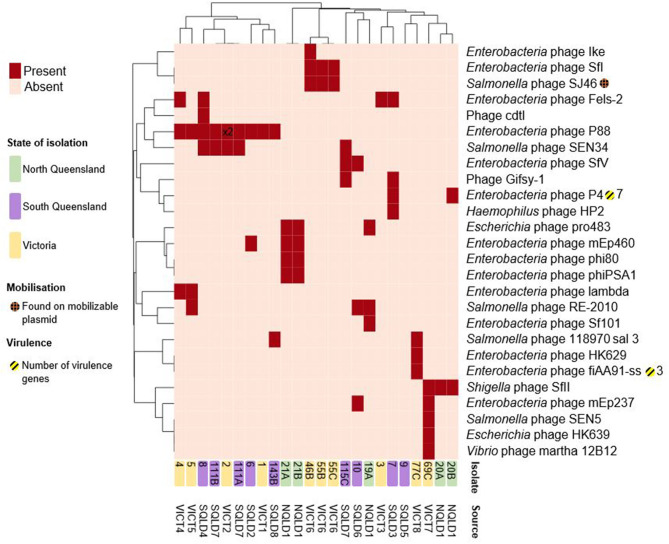
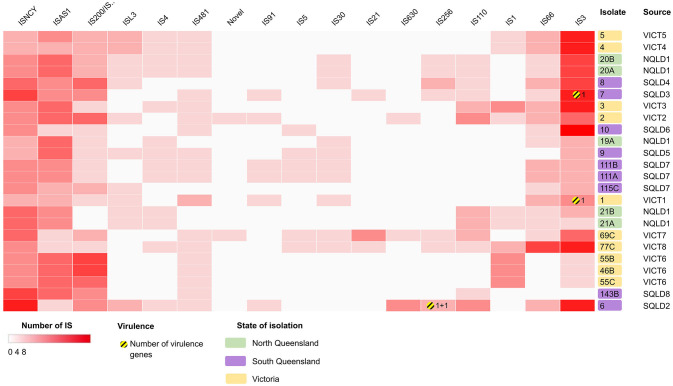
Escherichia coli is frequently associated with mastitis in cattle. "Pathogenic" and "commensal" isolates appear to be genetically similar. With a few exceptions, no notable genotypic differences have been found between commensal and mastitis-associated E. coli. In this study, 24 E. coli strains were isolated from dairy cows with clinical mastitis in three geographic regions of Australia (North Queensland, South Queensland, and Victoria), sequenced, then genomically surveyed. There was no observed relationship between sequence type (ST) and region (p = 0.51). The most common Multi Locus Sequence Type was ST10 (38%), then ST4429 (13%). Pangenomic analysis revealed a soft-core genome of 3,463 genes, including genes associated with antibiotic resistance, chemotaxis, motility, adhesion, biofilm formation, and pili. A total of 36 different plasmids were identified and generally found to have local distributions (p = 0.02). Only 2 plasmids contained antibiotic resistance genes, a p1303_5-like plasmid encoding multidrug-resistance (trimethoprim, quaternary ammonium, beta-lactam, streptomycin, sulfonamide, and kanamycin) from two North Queensland isolates on the same farm, while three Victorian isolates from the same farm contained a pCFSAN004177P_01-like plasmid encoding tetracycline-resistance. This pattern is consistent with a local spread of antibiotic resistance through plasmids of bovine mastitis cases. Notably, co-occurrence of plasmids containing virulence factors/antibiotic resistance with putative mobilization was rare, though the multidrug resistant p1303_5-like plasmid was predicted to be conjugative and is of some concern. This survey has provided greater understanding of antibiotic resistance within E. coli-associated bovine mastitis which will allow greater prediction and improved decision making in disease management.

Keywords: antibiotic resistance; cattle; comparative genomics; genomics; plasmid; virulence; whole genome sequencing.


Conflict of interest statement

MS was employed by the company Terragen Biotech Pty Ltd. The remaining authors declare that the research was conducted in the absence of any commercial or financial relationships that could be construed as a potential conflict of interest.

Figures

Figure 1
Figure 1
Map showing the geographical distribution of E. coli isolates sourced from farms across Australia: North Queensland farms (circles), South Queensland farms (triangles), and Victorian farms (squares). The symbols represent the townships centroids were the farms are located.
Figure 2
Figure 2
Maximum likelihood phylogenetic tree based on core genome of E. coli isolates identified in this study. Escherichia fergusonii ATCC 35469 was used as an outgroup and E. coli K-12 (MG1655) was used as an ingroup. Bootstrap values are shown on branches. Green labels show North Queensland isolates. Purple labels show South Queensland isolates. Yellow labels show Victorian isolates. ST stands for sequence type. Core genome alignment was performed in roary and maximum likelihood tree was built in RAxML with 1,000 replicates. Tree visualized in FigTree.
Figure 3
Figure 3
Chart of the most abundant Gene Onology (GO; core genome with counts ≥40) descriptions of the core genome of the E. coli isolates, ranked highest to lowest. Further GO annotations can be found in Supplementary Data Sheet 6.
Figure 4
Figure 4
Heatmap of plasmid presence/absence within each E. coli isolate based on the correlation between isolates (x-axis) and plasmids (y-axis). Dark blue rectangles indicate presence of a corresponding -like plasmid. Isolate 9 contained no plasmids and was excluded from the heatmap. Victorian isolates are colored in yellow, North Queensland in green, South Queensland in purple. Plasmid elements are shown on the right y-axis. Chromosomal elements are shown along the x-axis. Putative resistance genes are shown for plasmids and chromosomal DNA for each isolate, represented by striped circles; red shows trimethoprim, purple show quaternary ammonium, peach shows beta-lactam, dark blue shows streptomycin, light blue shows sunfonamide, pink shows kanamycin, green shows tetracycline. Putative plasmid mobilization represented by hashed circles; blue shows putatively conjugative, orange shows putatively mobilizable. Yellow-striped circles and the corresponding number represent presence and number of putative virulence factors. Heatmap produced using ClustVis.
Figure 5
Figure 5
Heatmap of presence/absence of putatively intact prophages within the E. coli isolates. Clusters were based on correlation between prophages (x-axis) and isolates (y-axis). Dark red rectangles show hits to -like phages. Further information including accession numbers can be found in Supplementary Data Sheet 4. Clustering shown on rows and columns using the “correlation” distance measure. Victorian isolates are colored in yellow, North Queensland in green, South Queensland in purple. Presence on a putatively mobilizable plasmid represented by orange-hashed circles. Yellow-striped circles and the corresponding number represent presence and number of putative virulence factors. Number shown on heatmap (x2) indicate multiple intact prophages within the same genome. Heatmap produced using ClustVis.
Figure 6
Figure 6
Heatmap showing the presence/absence of putatively intact insertion sequences (IS) within the E. coli isolates, clustered based on correlation between IS (x-axis) and isolates (y-axis). Darker red rectangles show more unique IS within the corresponding isolate. Further information can be found in Supplementary Data Sheet 5. Clustering shown on rows and columns using Euclidean correlation distance measure. Victorian isolates are colored in yellow, North Queensland in green, South Queensland in purple. Yellow-striped circles and the corresponding number represent presence and number of putative virulence factors. Heatmap produced using Clustergrammer.

References

    1. Grohn YT, Wilson DJ, Gonzalez RN, Hertl JA, Schulte H, et al. . Effect of pathogen-specific clinical mastitis on milk yield in dairy cows. J Dairy Sci. (2004) 87:3358–74. 10.3168/jds.S0022-0302(04)73472-4 - DOI - PubMed
    1. Halasa T, Huijps K, Osteras O, Hogeveen H. Economic effects of bovine mastitis and mastitis management: a review. Vet Q. (2007) 29:18–31. 10.1080/01652176.2007.9695224 - DOI - PubMed
    1. Hogeveen H, Huijps K, Lam TJGM. Economic aspects of mastitis: new developments. N Z Vet J. (2011) 59:16–23. 10.1080/00480169.2011.547165 - DOI - PubMed
    1. Erskine RJ, Walker RD, Bolin CA, Bartlett PC, White DG. Trends in antibacterial susceptibility of mastitis pathogens during a seven-year period. J Dairy Sci. (2002) 85:1111–8. 10.3168/jds.S0022-0302(02)74172-6 - DOI - PubMed
    1. Bradley AJ, Leach KA, Breen JE, Green LE, Green MJ. Survey of the incidence and aetiology of mastitis on dairy farms in England and Wales. Vet Rec. (2007) 160:253–8. 10.1136/vr.160.8.253 - DOI - PubMed

LinkOut - more resources