. 2020 Jun 20;7(6):563-573.
doi: 10.1364/optica.390409.

mHealth spectroscopy of blood hemoglobin with spectral super-resolution

Affiliations

mHealth spectroscopy of blood hemoglobin with spectral super-resolution

Sang Mok Park et al. Optica. .

Abstract

Although blood hemoglobin (Hgb) testing is a routine procedure in a variety of clinical situations, noninvasive, continuous, and real-time blood Hgb measurements are still challenging. Optical spectroscopy can offer noninvasive blood Hgb quantification, but requires bulky optical components that intrinsically limit the development of mobile health (mHealth) technologies. Here, we report spectral super-resolution (SSR) spectroscopy that virtually transforms the built-in camera (RGB sensor) of a smartphone into a hyperspectral imager for accurate and precise blood Hgb analyses. Statistical learning of SSR enables us to reconstruct detailed spectra from three color RGB data. Peripheral tissue imaging with a mobile application is further combined to compute exact blood Hgb content without a priori personalized calibration. Measurements over a wide range of blood Hgb values show reliable performance of SSR blood Hgb quantification. Given that SSR does not require additional hardware accessories, the mobility, simplicity, and affordability of conventional smartphones support the idea that SSR blood Hgb measurements can be used as an mHealth method.


Conflict of interest statement

Disclosures. SMP, MAV, MMH, and YLK are the inventors of provisional patent applications related to this work that have been filed to the U.S. Patents and Trademark Office by the Purdue Research Foundation (application Nos. 62945816 and 62945808 filed December 10, 2019). YLK is a founding member of HemaChrome, LLC. All other authors declare no conflicts of interest.

Figures
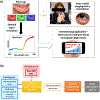
Fig. 1.
Fig. 1.
Spectral super-resolution (SSR) spectroscopy for mobile health (mHealth) hemoglobin (Hgb) analyses. (a) The inner eyelid (i.e., palpebral conjunctiva) is used as an accessible sensing site for noninvasive blood Hgb quantification. An RGB image of the inner eyelid is conveniently captured using the built-in camera of a smartphone. The subject simply pulls down the eyelid to expose the conjunctiva, and a healthcare professional takes a photograph of the eyelid. The mobile application collects red (R), green (G), and blue (B) color information from the eyelid image and applies SSR to mathematically reconstruct spectra in the visible wavelength range. The spectral intensity reflected from the inner eyelid is sensitive to changes in Hgb content in the blood. The reconstructed spectrum of the acquired eyelid image is then processed to accurately and precisely predict the amount of total blood Hgb content. The result displays the blood Hgb count in units of g dL−1 in the same manner of clinical laboratory Hgb tests. (b) Statistical learning in the mHematology for SSR blood Hgb computation developed using separate training and validation datasets. The first step is to apply SSR to the eyelid portion of the RGB image. The second step is to compute blood Hgb content in g dL−1 using the spectroscopic model of blood Hgb, which is also validated by the clinical laboratory blood Hgb tests (i.e., the gold standard).
Fig. 2.
Fig. 2.
High-quality spectra acquired by the image-guided hyperspectral line-scanning system and the mHematology mobile application. (a) Photograph of the image-guided hyperspectral line-scanning system for imaging the exact portion of the inner eyelid. The participant sits in front of the system, facing the telecentric lens, places the chin on the chinrest, and pulls down the eyelid for imaging when instructed. (b) Location where the hyperspectral line-scanning is performed (translucent white rectangle). The hyperspectral line-scan dataset contains spatial (y) and wavelength (λ) information. The averaged spectrum corresponds to the average intensity along the spatial y axis for each λ value. The characteristic absorption spectrum of blood Hgb is clearly visible. (c) mHematology mobile application developed for data acquisition in a low-end Android smartphone (Samsung Galaxy J3). On the main application screen, it displays a circle and arc to serve as guidance for locating the eyeball and the inner eyelid at consistent distance and position within the image. To remove the background room light, the application automatically acquires two RGB photographs by controlling the built-in flashlight (i.e., white-light LED) to turn on and off. To compensate for the system response, two RGB images of a reflectance standard are taken (left). Similarly, the application automatically takes two RGB images with flash on and flash off for the individual’s exposed eyelid (right). (d) Spectral profiles of the white-light LED illumination sources in the image-guided hyperspectral line-scanning system and Samsung Galaxy J3. The data acquisition procedure incorporates reference measurements of white reflectance standards (99% reflectivity in the visible range) to compensate for the spectral responses of the light source and the camera in the system.
Fig. 3.
Fig. 3.
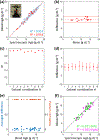
Performance of spectroscopic blood Hgb measurements of the left and right inner eyelids. (a) High correlations between the computed and clinical laboratory blood Hgb levels in both of the training (n = 138 plotted in blue) and validation (n = 15 plotted in red) datasets. (b) Bland–Altman analysis of comparing the computed blood Hgb levels with the clinical laboratory results, showing narrow 95% limits of agreement (LOA) of [−1.56, 1.58 g dL−1] with bias of 0.01 g dL−1 in the validation dataset. (c) R2 values between the computed blood Hgb levels and the clinical laboratory results of validation datasets from 10 different combinations of training and validation datasets. (d) LOA (error bar) and bias (square point) values of validation datasets from the different training-validation combinations. (e) and (f) Systematic comparisons of the spectra measured from the left (green) and right (magenta) inner eyelids among a subset of 36 participants. (e) The average spectral differences between the left and right eyelid spectra (Fig. S8) are statistically insignificant, and the Pearson correlation coefficients are close to 1 in all of the participants. (f) High correlations of the left and right spectroscopic blood Hgb measurements, compared with the clinical laboratory blood Hgb test results.
Fig. 4.
Fig. 4.
Comparisons between the original spectra and the SSR-reconstructed spectra. (a) and (b) Inner eyelids’ spectral intensity (acquired by the image-guided hyperspectral line-scanning system and the mHematology application) plotted with the clinical laboratory blood Hgb values (vertical axis) from the training dataset (n = 138). (c) Differences between the original and SSR-reconstructed spectra plotted with 95% confidence intervals at each wavelength. The transformation matrix that converts RGB data to spectral data is optimized by minimizing the differences in the training dataset. (d) Average spectral differences and Pearson correlation coefficients between the original and reconstructed spectra in the training dataset as a function of blood Hgb levels corresponding to each spectrum. (e) and (f) Inner eyelids’ spectral intensity (acquired by the image-guided hyperspectral line-scanning system and the mHematology application) visualized with the clinical laboratory blood Hgb values (vertical axis) from the validation dataset (n = 15). (g) Differences between the original and SSR-reconstructed spectra plotted with 95% confidence intervals at each wavelength are still small, supporting the high fidelity of SSR. The differences in the wavelength range between 450 and 575 nm are generally higher, because distinct Hgb absorption is present in this range [Fig. S5(d)]. (h) Average spectral differences and Pearson correlation coefficients between the original and reconstructed spectra in the validation dataset as a function of blood Hgb levels.
Fig. 5.
Fig. 5.
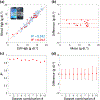
Performance of SSR blood Hgb measurements with the mHematology mobile application. (a) High correlations between the SSR-computed and clinical laboratory blood Hgb levels in both training (n = 138 plotted in blue) and validation (n = 15 plotted in red) datasets. (b) Bland-Altman analyses of comparing the computed blood Hgb measurements with the clinical laboratory results, showing narrow 95% limits of agreement (LOA) of [−2.20, 2.29 g dL−1] and bias of 0.04 g dL−1 in the validation dataset. In particular, the bias is not associated with actual blood Hgb levels in the validation dataset (Table S3 in Supplement 1). (c) R2 values between the computed blood Hgb levels and the clinical laboratory results of validation datasets from 10 different combinations of training and validation datasets. (d) LOA (error bar) and bias (square point) values of validation datasets from the different training–validation combinations. The mHematology application reliably predicts the actual blood Hgb levels without any hardware attachments to the smartphone.

Similar articles

Cited by

References

    1. Hsia CCW, “Mechanisms of disease - respiratory function of hemoglobin,” N. Engl. J. Med 338, 239–247 (1998). - PubMed
    1. Cannon JW, “Hemorrhagic shock,” N. Engl. J. Med 378, 370–379 (2018). - PubMed
    1. Hasan MN, Fraiwan A, Thota P, Oginni T, Olanipekun GM, Hassan-Hanga F, Little J, Obaro SK, and Gurkan UA, “Clinical testing of hemechip in Nigeria for point-of-care screening of sickle cell disease,” Blood 132, 1095 (2018). - PubMed
    1. Juul SE, Derman RJ, and Auerbach M, “Perinatal iron deficiency: implications for mothers and infants,” Neonatology 115, 269–274 (2019). - PubMed
    1. Smart LR, Ambrose EE, Raphael KC, Hokororo A, Kamugisha E, Tyburski EA, Lam WA, Ware RE, and McGann PT, “Simultaneous point-of-care detection of anemia and sickle cell disease in Tanzania: the rapid study,” Ann. Hematol 97, 239–246(2018). - PMC - PubMed

LinkOut - more resources