

Nitrogen use efficiency and critical leaf N concentration of Aloe vera in urea and diammonium phosphate amended soil
- PMID: 33367129
- PMCID: PMC7749385
- DOI: 10.1016/j.heliyon.2020.e05718
Nitrogen use efficiency and critical leaf N concentration of Aloe vera in urea and diammonium phosphate amended soil
Abstract
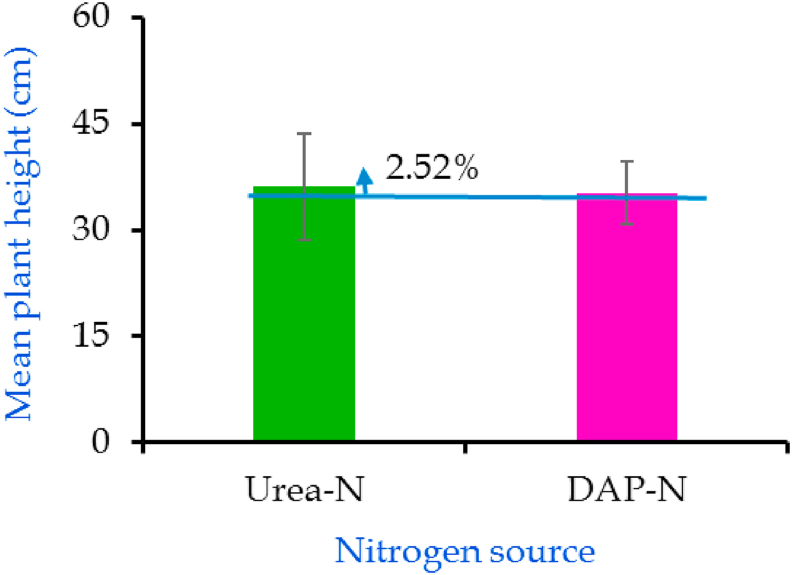
Aloe vera L. is widely cultivated in many countries due to its importance as an all-purpose herbal or medicinal plant. The growth and yield of this plant can be enhanced by application of fertilizer. It is expected that a higher and balanced nutrient supply will result in higher crop production maintaining soil health, which is possible when the applied fertilizers are done in way that is efficient. So, there is a need to understand the amount of applied and type of fertilizer that will give the best output for farmers and to formulate economical market products. This study was conducted to investigate the effect of N fertilizer on leaf yield, its uptake and requirement, critical concentration, use efficiency and economics of Aloe vera L. Plants were grown at six levels of N: 0, 40, 80, 100, 150 and 200 kg ha-1 from urea and diammonium phosphate (DAP) following completely randomized design with three replicates under field condition. The highest values of yield and yield attributes and profit based on benefit cost ratio (3.81 for urea and 2.91 for DAP) were obtained with 150 kg N ha-1 (urea) and 100 kg N ha-1 (DAP). Leaf biomass yield increased by 18-128 % in urea-N and 30-139 % in DAP-N fertilized plant over control while DAP > urea by 7.59 %. Sucker production (mean number) was urea-N (4.95 Plant-1) > DAP-N (2.28 Plant-1). Both gel and leaf N concentration and uptake was highest at 200 kg ha-1 for both sources. For 80 % leaf biomass yield, minimum requirement of N was ca 74.90 (urea) and 89.60 kg ha-1 (DAP). Growth and yield parameters to N application exhibited significant and positive correlations. Critical leaf N concentration was ca 0.88% (DAP) and 0.90% (urea) while mean and maximum NUE was 34% and 64 % (urea) and 43% and 69% (DAP), respectively. Farmers can be advised to apply N at the rate of 150 kg ha-1 from urea for producing economically higher yield and better-quality A. vera leaves.
Keywords: Agricultural science; Aloe vera L.; Biological sciences; Chemistry; Critical N concentration; DAP; Environmental science; Food science; Leaf yield; NUE; Urea.
© 2020 The Author(s).
Conflict of interest statement
The authors declare no conflict of interest.
Figures


References
-
- Abbas F., Fares A. Best management practices in citrus production. Tree and Forestry SciBiotech. 2009;3:1–11.
-
- Akev N., Can A., Sütlüpınar N., Çandöken E., Özsoy N., Özden T.Y., Yanardağ R., Üzen E. Twenty years of research on Aloe vera. J. Fac. Pharm. Istanbul. 2015;45(2):191–215.
-
- Alizadeh A., Khoshkhui M., Javidnia K., Firuzi O., Tafazoli E., Khalighi A. Effects of fertilizer on yield, essential oil composition, total phenolic content and antioxidant activity in Saturejahortensis L. (Lamiaceae) cultivated in Iran. J. Med. Plants Res. 2010;4(1):33–40.
-
- Allahdadi M., Farzane P. Influence of different levels of nitrogen fertilizer on some phytochemical characteristics of artichoke (Cynarascolymus L.) leaves. J. Med. Plants. 2018;6:109–115.
-
- Angkapradipta P., Tuti-Watsite, Faturachim P. The N, P and K fertilizer requirements of Stevia rebaudiana Bert. onlatosolic soil Menaraperkebaunan, Horti. Abstracts. 1986;56:9217.
LinkOut - more resources
Full Text Sources
Research Materials
