. 2020 Jun 24;1(4):100089.
doi: 10.1016/j.xplc.2020.100089. eCollection 2020 Jul 13.

Variation Patterns of NLR Clusters in Arabidopsis thaliana Genomes

Affiliations

Variation Patterns of NLR Clusters in Arabidopsis thaliana Genomes

Rachelle R Q Lee et al. Plant Commun. .

Abstract

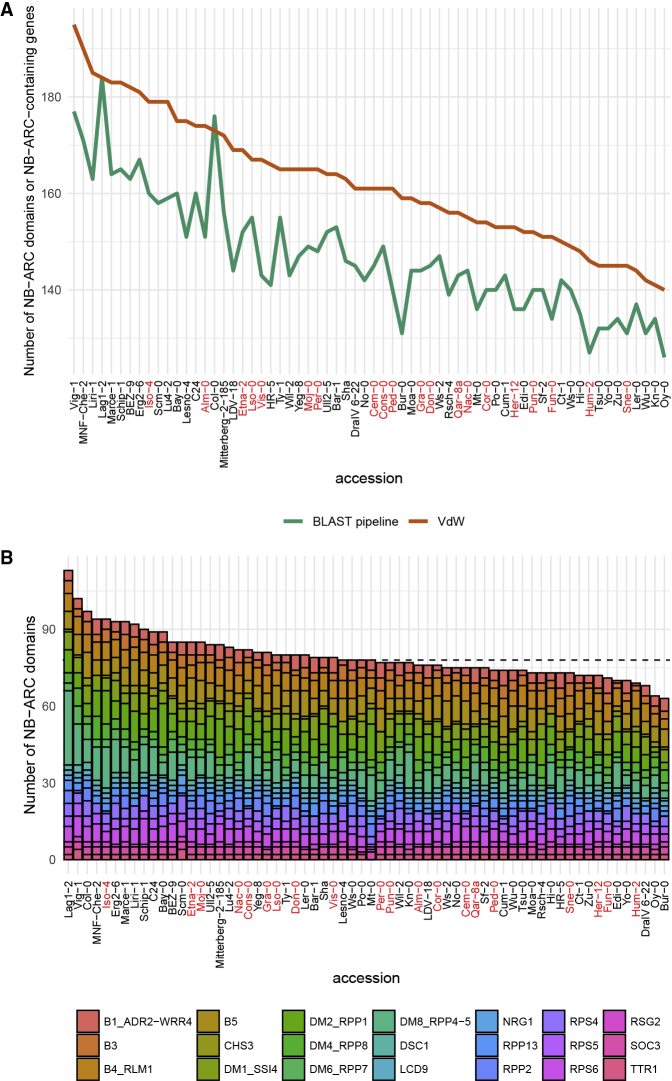
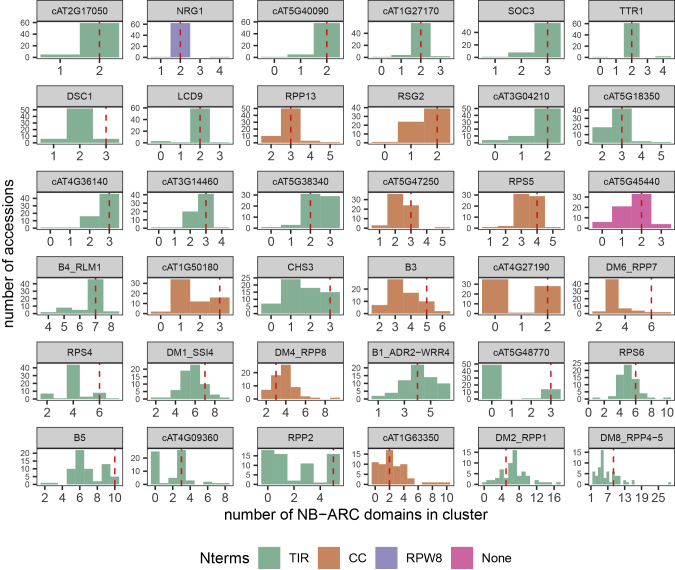
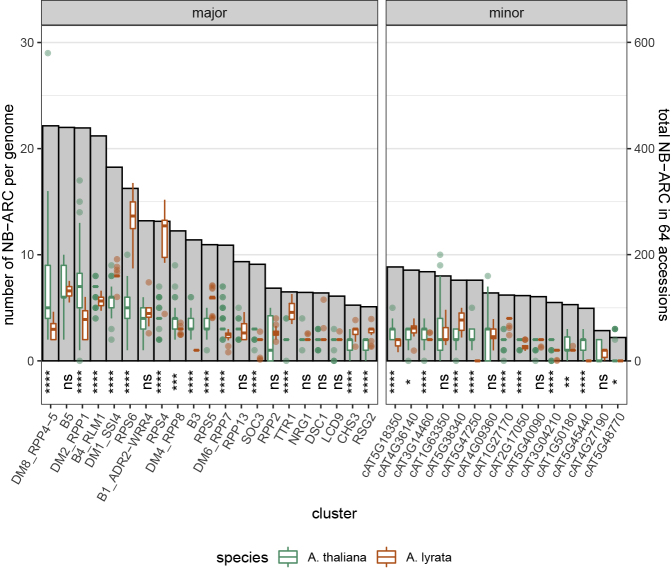
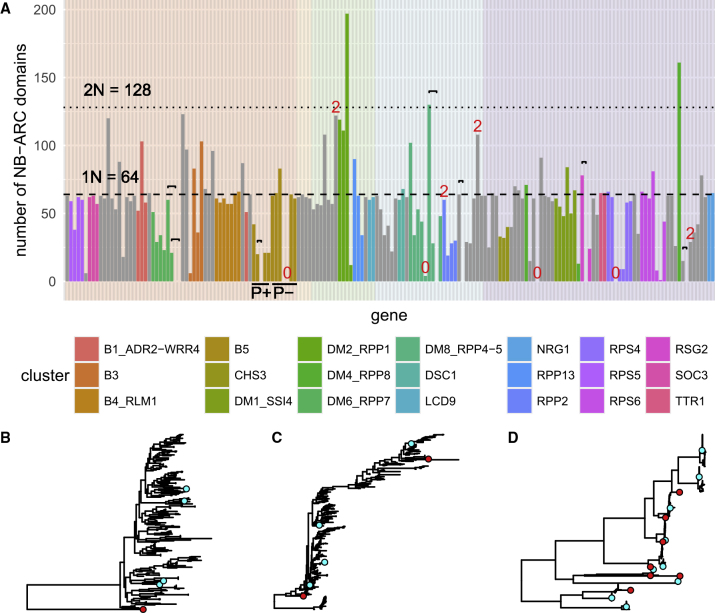
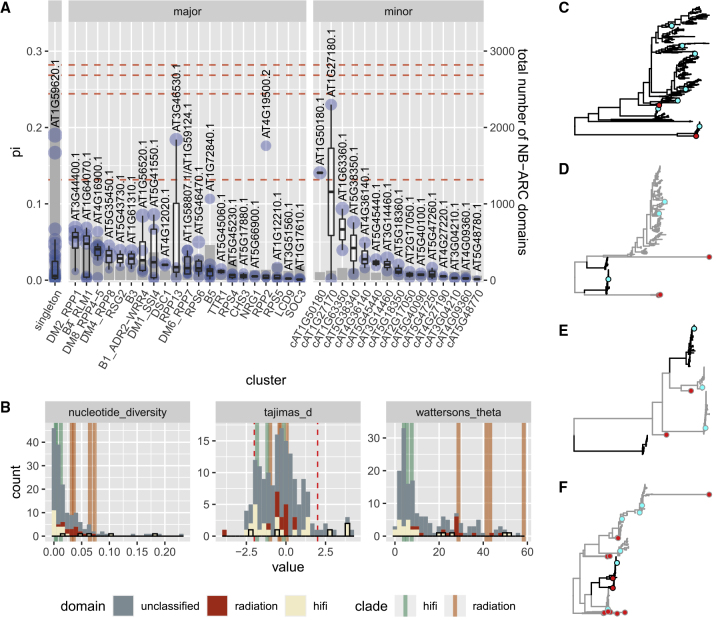
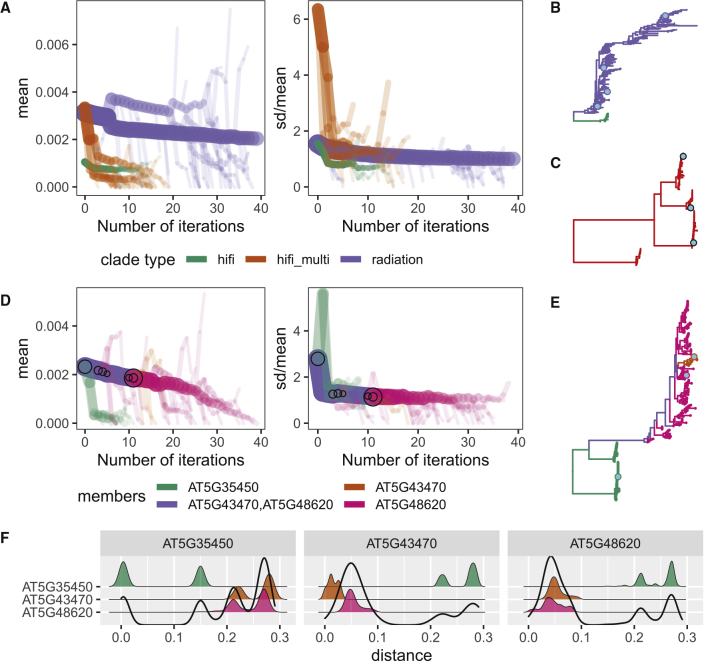
The nucleotide-binding domain and leucine-rich repeat (NLR) gene family is highly expanded in the plant lineage with extensive sequence and structure polymorphisms. To survey the landscape of NLR expansion, we mined the published long-read data generated by the resistance gene enrichment sequencing of 64 diverse Arabidopsis thaliana accessions. We found that the hot spots of massive multi-gene NLR cluster expansion did not typically span the whole cluster; instead, they were restricted to a handful of, or only one, dominant radiation(s). All sequences in such a radiation were distinct from other genes in the cluster but not from each other in the clade, making it difficult to assign trustworthy reference-based orthologies when multiple reference genes were present in the radiation. Consequently, NLR genes can be broadly divided into two types: radiating or high-fidelity, where high-fidelity genes are well conserved and well separated from other clades. A similar distinction could be made for NLR clusters, depending on whether cluster size was determined primarily by extensive radiation or the presence of numerous high-fidelity genes. We also identified groups of well-conserved NLR clades that were missing from the Columbia-0 reference genome. This suggests that the classification of NLRs using gene IDs from a single reference accession can rarely capture all major paralogs in a cluster accurately and representatively and that a reference-agnostic perspective is required to properly characterize these additional variations. Finally, we present a quantitative visualization method for differentiating these situations in a given clade of interest.

Keywords: NLR; cluster; disease resistance; evolution; phylogenetics; plant immunity.


Figures

Figure 1
Figure 1
Summary of the NB-ARC Domain Repertoire in 64 A. thaliana Accessions. (A) Number of NB-ARC-containing genes identified by Van de Weyer et al. (2019) (VdW) and NB-ARC domains discovered by the pipeline in this study (BLAST pipeline). (B) Size of major cluster NB-ARC domain repertoires identified in this study, grouped by accession number, and sorted by total cluster repertoire size. The median repertoire size is indicated by a dashed line. Relict accessions are indicated in red.
Figure 2
Figure 2
Patterns of NB-ARC Copy-Number Variation by Cluster. Histogram of cluster sizes in 64 different A. thaliana accessions. Clusters are colored by the presence of TIR, CC, or RPW8 domains present in their NLR genes and sorted by the SD of cluster sizes. Red dashed lines indicate the size of each cluster in the Col-0 reference genome.
Figure 3
Figure 3
Copy-Number Variation of Cluster NB-ARC Domains across 64 A. thaliana Accessions and 17 A. lyrata Accessions. Box plot (y-axis left): the number of cluster members distributed across accessions, with hinges corresponding with the 25th and 75th quartiles, and whiskers extending to the smallest and largest values within 1.5 times the interquartile range from the lower and upper hinges, respectively. Bar plot (gray; y-axis right): total number of NB-ARC domains assigned to each cluster across all accessions. Wilcoxon rank-sum test (two-sided) for interspecies comparison: ∗∗∗∗p ≤ 0.0001, ∗∗∗p ≤ 0.001, ∗∗p ≤ 0.01, ∗p ≤ 0.05; ns: p ≥ 0.05.
Figure 4
Figure 4
Expansion in High CNV Clusters Can Be Attributed to a Single Massive Radiation. (A) The number of NB-ARC homologs assigned to each gene was plotted, ordered by position in the genome, and colored by cluster. The background is colored to distinguish the five chromosomes. Singletons are in gray. Black brackets connect genes with identical NB-ARC sequences (including intervening introns), and red numbers indicate the number of NB-ARC domains in genes with more than one or fewer than one NB-ARC domain as detected by rpsblast+. P+ and P− indicate genes containing functional and degenerate P loops, respectively, in the B5 cluster. (B–D) NB-ARC trees of B3 (B), DM2/RPP1(C), and B5 (D) cluster NB-ARCs showing various degrees of conservation and radiation. Non-B5 cluster sequences that form a monophyletic clade with the B5 cluster are not included in the tree in (D). Col-0 and A. lyrata sequences are shown in cyan and red, respectively.
Figure 5
Figure 5
Cluster Sequence Diversity Is Often Asymmetric. (A) Nucleotide diversity of NB-ARC domains in each gene in each major cluster calculated per domain from coding sequences only. Refer to Figure 3 for descriptions on boxplot hinges and whiskers. The gene with the highest nucleotide diversity in the NB-ARC domain in each cluster is shown. “.1” and “.2” denote the first and second NB-ARC domains in the gene from the N terminus, respectively. The sizes of blue circles are proportional to the total number of homologs for each gene across all 64 accessions. Red dashed lines denote the nucleotide diversity of NB-ARCs from four A. thaliana genes with two NB-ARC domains when nucleotide diversity is calculated for both domains together. (B) Histogram of the nucleotide diversity (calculated as in A), Tajima's D, and Watterson's theta of the CDS region of all A. thaliana NLR NB-ARC domains, with selected NB-ARCs belonging to radiating and high-fidelity clades colored in red and beige, respectively. In the back, each statistic was calculated as a whole for three high-fidelity (green) and four radiating (orange) representative clades. See Supplemental Table 10 for domains and clades classified as radiating or high-fidelity. Red dashed lines indicate Tajima's D values of −2 and 2, which are generally considered significant. (C–F) NB-ARC trees of the DM8/RPP4/RPP5(C), DM4/RPP8(D), RPP13(E), and RPS6(F) clusters showing examples of a cluster with high sequence diversity (C) and clusters with conserved clades missing in Col-0 (D–F). Col-0 and A. lyrata sequences are shown in cyan and red, respectively. Conflated clades are shown in black in (D) to (F), while the rest of the cluster is shown in gray.
Figure 6
Figure 6
Visualization and Quantification of Clade Types. (A and D) Bifurcating plots of the decay of mean and SD as representative clades (A) or the DM4/RPP8 cluster (D) progressively split at their longest branch for 40 iterations, colored by clade type (A) and the set of reference gene ID(s) assigned to clade members (D), respectively. Line width and opacity are proportional to the number of branches in the clade. Clades with only one terminal leaf are not shown. In (A), “hifi” represents the high-fidelity clade and “hifi_multi” denotes the clade containing multiple distinct high-fidelity sub-clades. In (D), circles mark splits that alter gene membership within clades from one iteration to the next, and their sizes are proportional to the number of branches in each resulting clade. (B, C, and E) NB-ARC trees of the DM2/RPP1(B) and RPP13(C) clusters analyzed in (A) and the DM4/RPP8 cluster (E) analyzed in (D). Clades are colored according to the legends of the relevant decay plots. Col-0 sequences are shown in cyan. (F) Density plots of intracluster pairwise distances between terminal nodes in the DM4/RPP8 cluster, grouped by assigned reference gene homolog and colored along the y-axis according to the same legend as (D). The combination of facet title and y-axis label indicates the pairwise comparisons included in each density plot. The unfilled distribution at the forefront is the overall distribution of all distances between homologs assigned to the gene in the facet title and all sequences in the cluster.

References

    1. Abyzov A., Urban A.E., Snyder M., Gerstein M. CNVnator: an approach to discover, genotype, and characterize typical and atypical CNVs from family and population genome sequencing. Genome Res. 2011;21:974–984. - PMC - PubMed
    1. Adachi H., Derevnina L., Kamoun S. NLR singletons, pairs, and networks: evolution, assembly, and regulation of the intracellular immunoreceptor circuitry of plants. Curr. Opin. Plant Biol. 2019;50:121–131. - PubMed
    1. Alcázar R., García A.V., Parker J.E., Reymond M. Incremental steps toward incompatibility revealed by Arabidopsis epistatic interactions modulating salicylic acid pathway activation. Proc. Natl. Acad. Sci. U S A. 2009;106:334–339. - PMC - PubMed
    1. Altschul S.F., Gish W., Miller W., Myers E.W., Lipman D.J. Basic local alignment search tool. J. Mol. Biol. 1990;215:403–410. - PubMed
    1. van der Biezen E.A., Jones J.D. The NB-ARC domain: a novel signalling motif shared by plant resistance gene products and regulators of cell death in animals. Curr. Biol. 1998;8:R226–R227. - PubMed

Publication types

MeSH terms

LinkOut - more resources