. 2020 Sep 11;1(6):100111.
doi: 10.1016/j.xplc.2020.100111. eCollection 2020 Nov 9.

Demographic Processes Linked to Genetic Diversity and Positive Selection across a Species' Range

Affiliations

Demographic Processes Linked to Genetic Diversity and Positive Selection across a Species' Range

Yvonne Willi et al. Plant Commun. .

Abstract

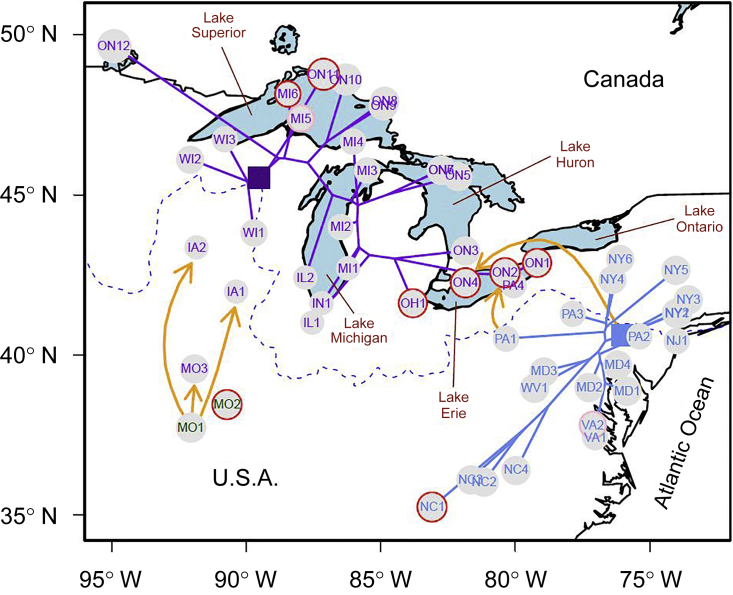
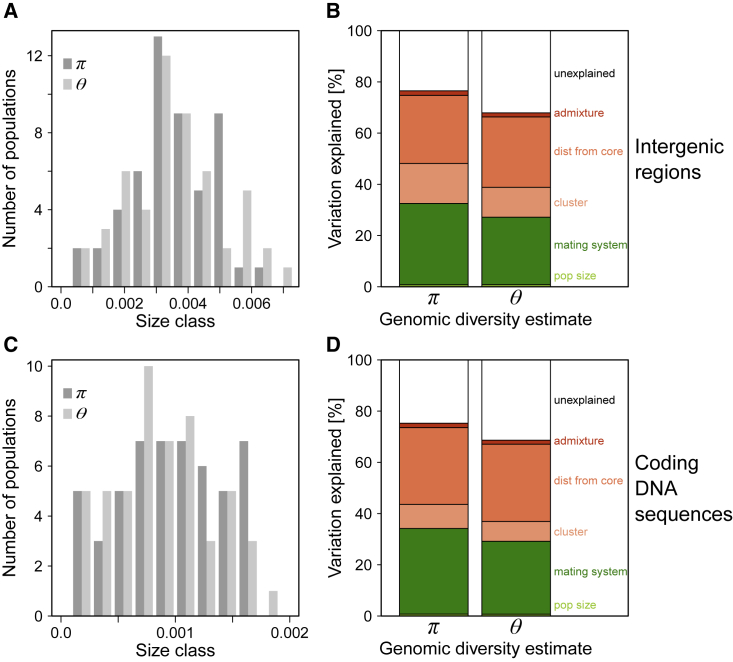
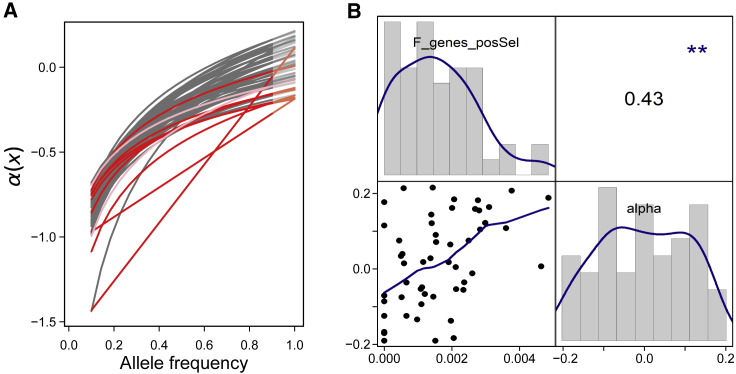
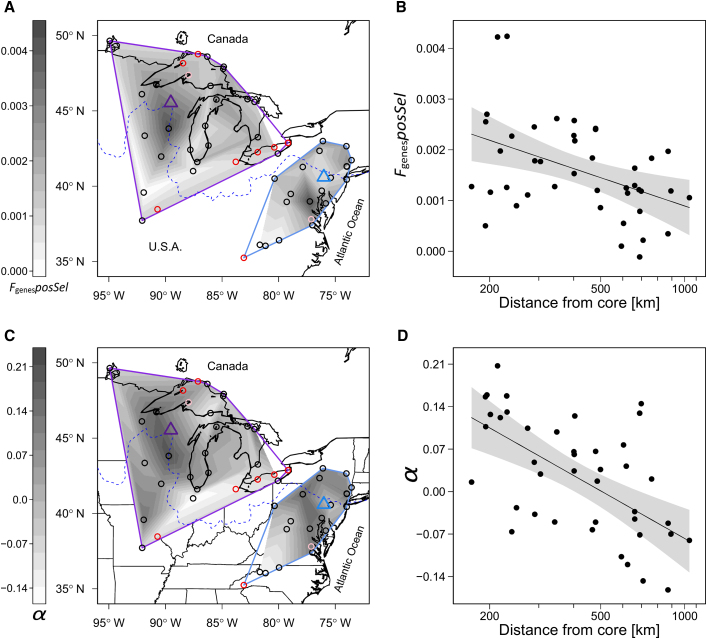
Demography determines the strength of genetic drift, which generally reduces genetic variation and the efficacy of selection. Here, we disentangled the importance of demographic processes at a local scale (census size and mating system) and at a species-range scale (old split between population clusters, recolonization after the last glaciation cycle, and admixture) in determining within-population genomic diversity and genomic signatures of positive selection. Analyses were based on re-sequence data from 52 populations of North American Arabidopsis lyrata collected across its entire distribution. The mating system and range dynamics since the last glaciation cycle explained around 60% of the variation in genomic diversity among populations and 52% of the variation in the signature of positive selection. Diversity was lowest in selfing compared with outcrossing populations and in areas further away from glacial refugia. In parallel, reduced positive selection was found in selfing populations and in populations with a longer route of postglacial range expansion. The signature of positive selection was also reduced in populations without admixture. We conclude that recent range expansion can have a profound influence on diversity in coding and non-coding DNA, similar in magnitude to the shift toward selfing. Distribution limits may in fact be caused by reduced effective population size and compromised positive selection in recently colonized parts of the range.

Keywords: admixture-dependent selection; directional selection; genetic drift; range expansion; selfing; small population size.


Figures

Figure 1
Figure 1
Map of North American Arabidopsis lyrata Populations Included in this Study. The populations are indicated by abbreviations (state/province, followed by a number that sorts populations along latitude in the USA and longitude in Ontario, Canada). The two populations of the Ozarks clade are indicated in green, those of the mid-western clade in purple, and those of the eastern clade in blue. For the latter two clades, the relatedness tree starting from the deduced glacial refuge is plotted on the map, in purple for the western clade and in blue for the eastern clade. The position of the most recent common ancestor of populations that appeared after the LGM is represented with squares. Selfing and mixed-mating populations are highlighted by red and pink circles, respectively. The yellow arrows indicate admixture events supported by statistical testing (details in the Results section). The dashed blue line shows the maximum extent of the ice at the last glacial maximum.
Figure 2
Figure 2
Distribution of Population Estimates of Genomic Diversity in North American Arabidopsis lyrata and the Demographic Processes Associated with Them. Genomic diversity was estimated by Tajima's π and Watterson's θ in intergenic regions (A) and coding DNA (C), and demographic processes at local and species-range scales were considered (B and D). On the local scale, factors included population census size and the mating system, and on the species-range scale, they included an old split between population clusters, distance to core mainly depicting recolonization after the last glaciation cycle, and admixture between ancestral groups. Results of the linear models are presented in Table 1; the sample size was 52 populations.
Figure 3
Figure 3
Distribution of and Relationship between Two Population Estimates of Signatures of Positive Selection in North American Arabidopsis lyrata. The two estimates are the fraction of genes with a significant McDonald-Kreitman test (FgenesposSel) and α. Values of α(x), calculated for each population across bins of site frequency spectra (x, from 0.1 to 0.9) of non-synonymous and synonymous sites, are shown (A). Fitted curves are exponential when possible and linear otherwise. The asymptote (deduced for x = 1) reveals the rate of adaptive evolution in non-synonymous compared with synonymous sites, α. Colors represent populations of the different mating systems: outcrossing in gray, selfing in red, and mixed-mating in pink. In addition, the distribution of the two estimates of positive selection is shown (B). Along the diagonal, histograms of the estimates are plotted, in the lower triangle a scatterplot between the estimates with predictions from a locally fit polynomial model, and in the upper triangle the Pearson correlation coefficient (with significance indicated by stars).
Figure 4
Figure 4
Geographic Pattern of the Genomic Signatures of Positive Selection in North American Arabidopsis lyrata, and Their Relationship with Distance from Core, Mainly Depicting Recolonization Distance after the Last Glaciation Cycle. Results are shown on the estimate of the fraction of genes with a significant McDonald-Kreitman test (FgenesposSel) (A and B), and on the rate of adaptation, α, calculated by the aMK method on non-synonymous and synonymous sites (C and D). All panels are based on outcrossing populations only (and after correcting for all factors explaining >1% of variation, except for distance from core). The locations of selfing (red circles) and mixed-mating populations (pink circles) are shown for completeness (A and C). Maps show interpolated estimates within minimum convex polygon hulls surrounding populations of the western and eastern ancestral genetic clusters in purple and blue. Triangles indicate the core areas from which recolonization began after the most recent glacial maximum. Unshaded areas within the polygon hulls are regions with no outcrossing populations. The dashed blue line indicates the maximum extent of the ice sheet during the last glacial maximum. Plots on the right show regression lines (in black) and 95% confidence intervals (gray surface) of the relationship between population estimates of positive selection and distance from core (B and D). Signatures of positive selection declined with increasing distance from the core areas.

Comment in

  • Plant Evolutionary Adaptation.
    Rieseberg LH, Gao L. Rieseberg LH, et al. Plant Commun. 2020 Oct 31;1(6):100118. doi: 10.1016/j.xplc.2020.100118. eCollection 2020 Nov 9. Plant Commun. 2020. PMID: 33367271 Free PMC article. No abstract available.

Similar articles

Cited by

References

    1. Akima H., Gebhardt A., Petzold T., Maechler M., YYYY Association for Computing Machinery, Inc. Comprehensive R Archive Network; 2016. Package ‘Akima’.
    1. Baker H.G. Self-compatibility and establishment after “long-distance” dispersal. Evolution. 1955;9:347–349.
    1. Beatty G.E., Provan J. Refugial persistence and postglacial recolonization of North America by the cold-tolerant herbaceous plant Orthilia secunda. Mol. Ecol. 2010;19:5009–5021. - PubMed
    1. Caballero A. Developments in the prediction of effective population size. Heredity. 1994;73:657–679. - PubMed
    1. Carleial S., van Kleunen M., Stift M. Small reductions in corolla size and pollen: ovule ratio, but no changes in flower shape in selfing populations of the North American Arabidopsis lyrata. Oecologia. 2017;183:401–413. - PubMed

Publication types

LinkOut - more resources