Occupational Asbestos Exposure and Kidney Cancer: Systematic Review and Meta-analysis of Cohort Studies
- PMID: 33367604
- PMCID: PMC8062011
- DOI: 10.1093/annweh/wxaa114
Occupational Asbestos Exposure and Kidney Cancer: Systematic Review and Meta-analysis of Cohort Studies
Abstract
Objectives: An estimated 125 million workers are exposed to asbestos worldwide. Asbestos is classified by the International Agency for Research on Cancer as a Group 1 carcinogen. The association between occupational asbestos exposure and kidney cancer is not well established however. This study aimed to determine the mortality and incidence of kidney cancer in workers who have been exposed to asbestos. We performed a systematic review and meta-analysis to evaluate the association between occupational asbestos exposure and kidney cancer.
Methods: Medline, EMBASE, and Web of Science were searched according to the Preferred Reporting Items for Systematic Reviews and Meta-Analyses (PRISMA) guidelines for articles on occupational asbestos exposure and kidney cancer. The studies reported the standardized mortality ratio (SMR) or standardized incidence ratio (SIR) of kidney cancer in workers exposed to asbestos. SMRs or SIRs with its 95% confidence interval (CI) were pooled using a fixed-effect model.
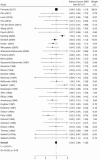
Results: Forty-nine cohort studies involving 335 492 workers were selected for analysis. These studies included 468 kidney cancer deaths and 160 incident cases. The overall pooled-SMR of kidney cancer was 0.95 (95% CI: 0.86-1.05), with no significant heterogeneity (PQ = 0.09, I2 = 24.87%). The overall pooled-SIR of kidney cancer was 0.95 (95% CI: 0.79-1.11), with no significant heterogeneity (PQ = 0.68, I2 = 0.00%). Subgroup analysis did not find any increased association with occupational asbestos exposure. There was no evidence of publication bias with Egger's test P values of 0.08 for mortality studies and 0.99 for incidence studies.
Conclusions: This systematic review and meta-analysis did not show evidence of association between occupational asbestos exposure and kidney cancer mortality or incidence.
Keywords: asbestos; kidney cancer; meta-analysis; occupational exposure; systematic review.
© The Author(s) 2020. Published by Oxford University Press on behalf of the British Occupational Hygiene Society.
Figures


References
-
- Burki T. (2009) Asbestos production increases despite WHO opposition. Lancet Oncol; 10: 846. - PubMed
-
- Cook PM, Olson GF. (1979) Ingested mineral fibers: elimination in human urine. Science; 204: 195–8. - PubMed
-
- Copeland KT, Checkoway H, McMichael AJet al. (1977) Bias due to misclassification in the estimation of relative risk. Am J Epidemiol; 105: 488–95. - PubMed
Publication types
MeSH terms
Substances
LinkOut - more resources
Full Text Sources
Medical
