. 2021 Jun 1;23(6):932-944.
doi: 10.1093/neuonc/noaa297.

Identification of diverse tumor endothelial cell populations in malignant glioma

Affiliations

Identification of diverse tumor endothelial cell populations in malignant glioma

Jeff C Carlson et al. Neuro Oncol. .

Abstract

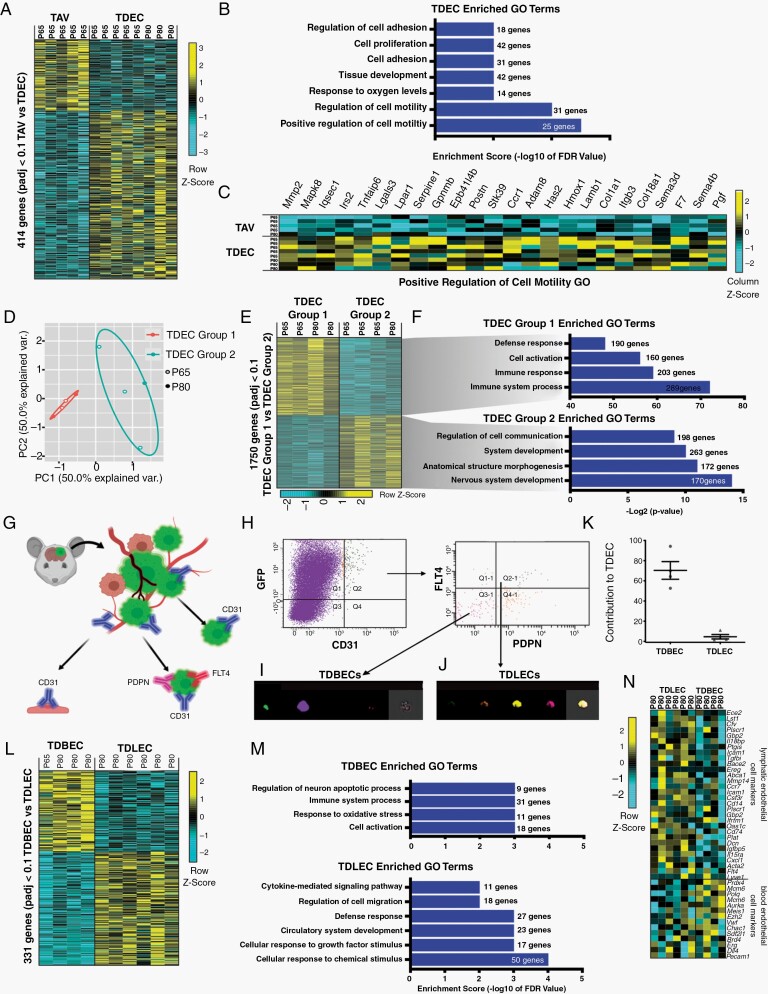
Background: Glioblastoma is the most common and aggressive type of primary brain tumor, as most patients succumb to the disease less than two years after diagnosis. Critically, studies demonstrate that glioma recruits surrounding blood vessels, while some work suggests that tumor stem cells themselves directly differentiate into endothelial cells, yet the molecular and cellular dynamics of the endothelium in glioma are poorly characterized. The goal of this study was to establish molecular and morphological benchmarks for tumor associated vessels (TAVs) and tumor derived endothelial cells (TDECs) during glioblastoma progression.

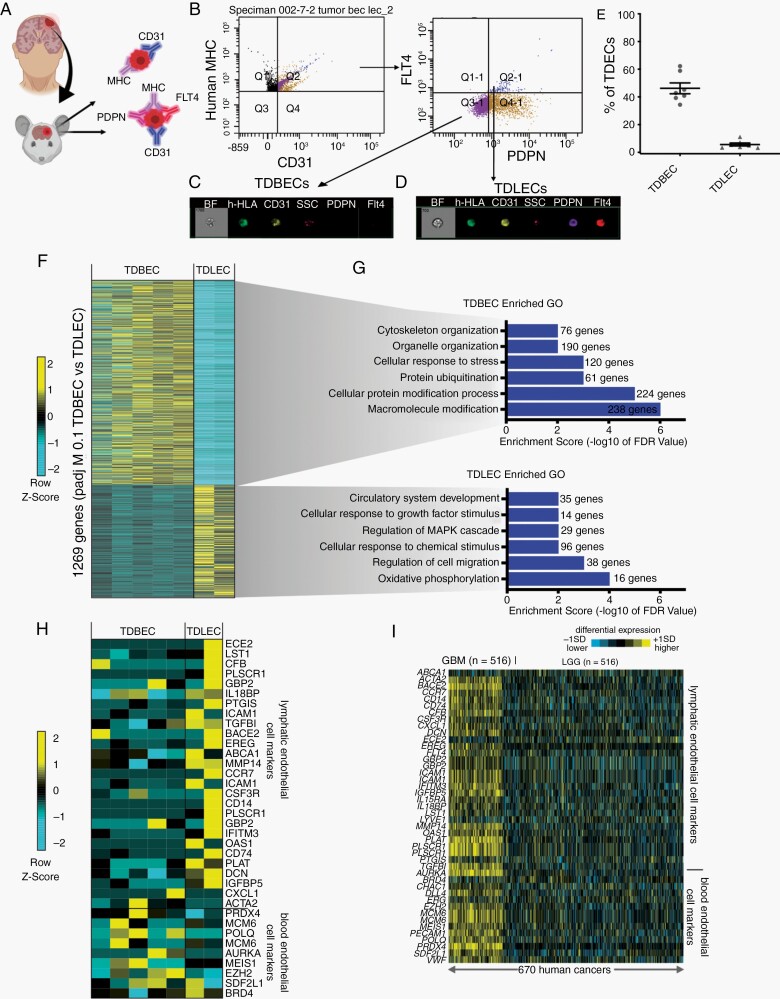
Methods: Using In-Utero Electroporation and CRISPR/Cas9 genome engineering to generate a native, immunocompetent mouse model of glioma, we characterized vascular-tumor dynamics in three dimensions during tumor progression. We employed bulk and single-cell RNA-Sequencing to elucidate the relationship between TAVs and TDECs. We confirmed our findings in a patient derived orthotopic xenograft (PDOX) model.

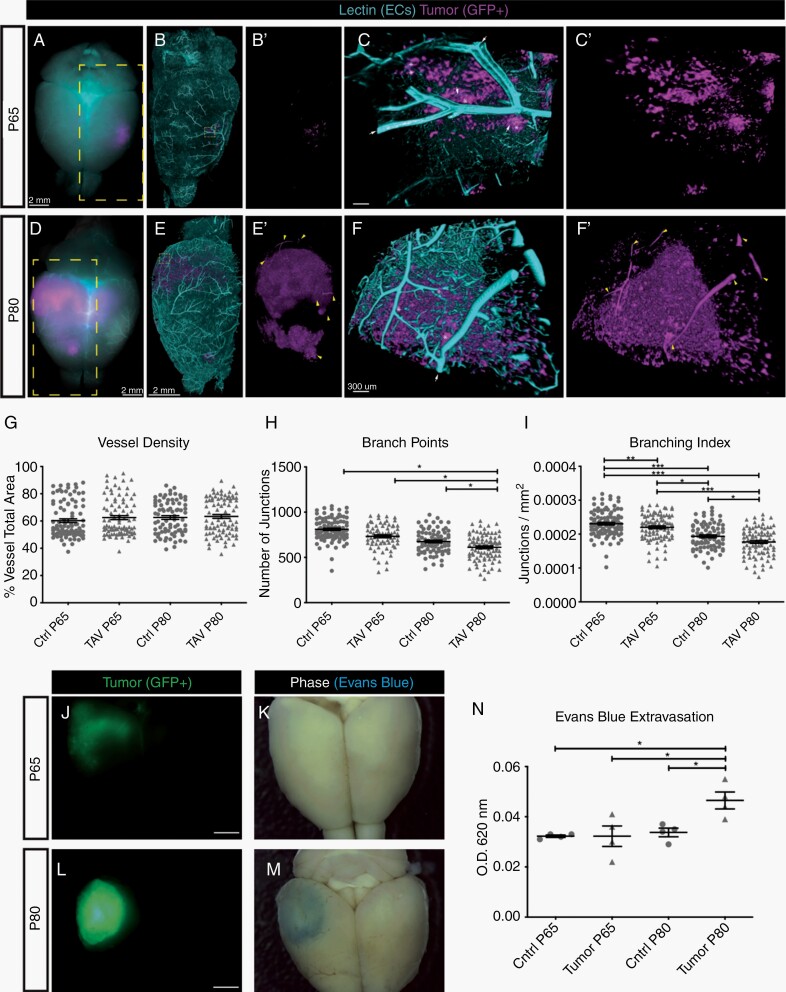
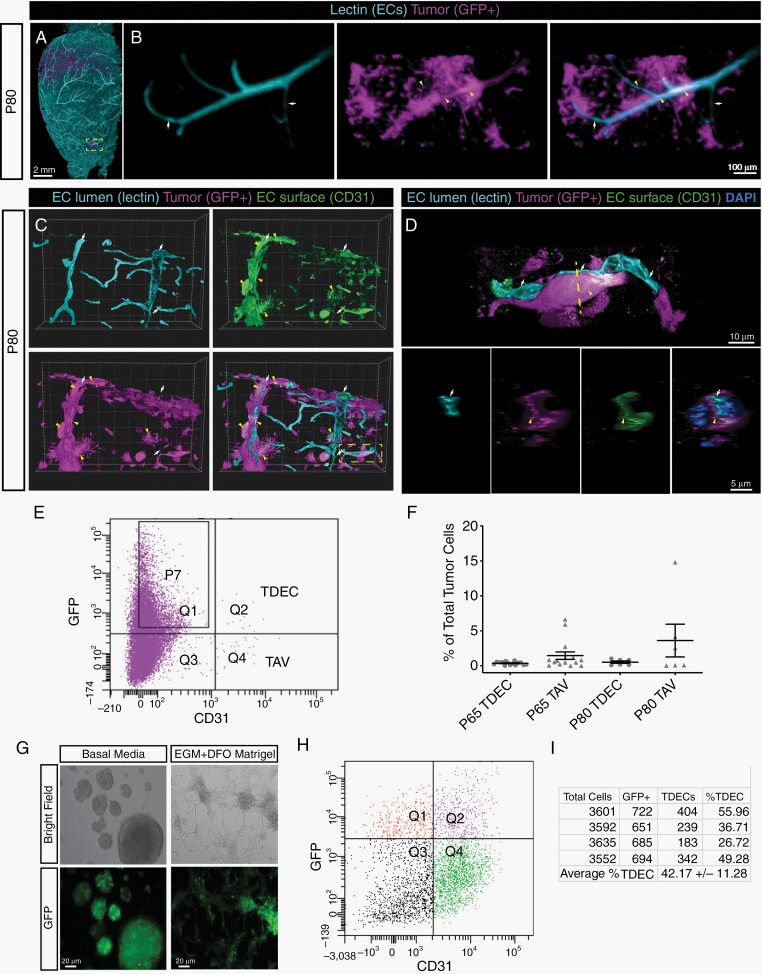
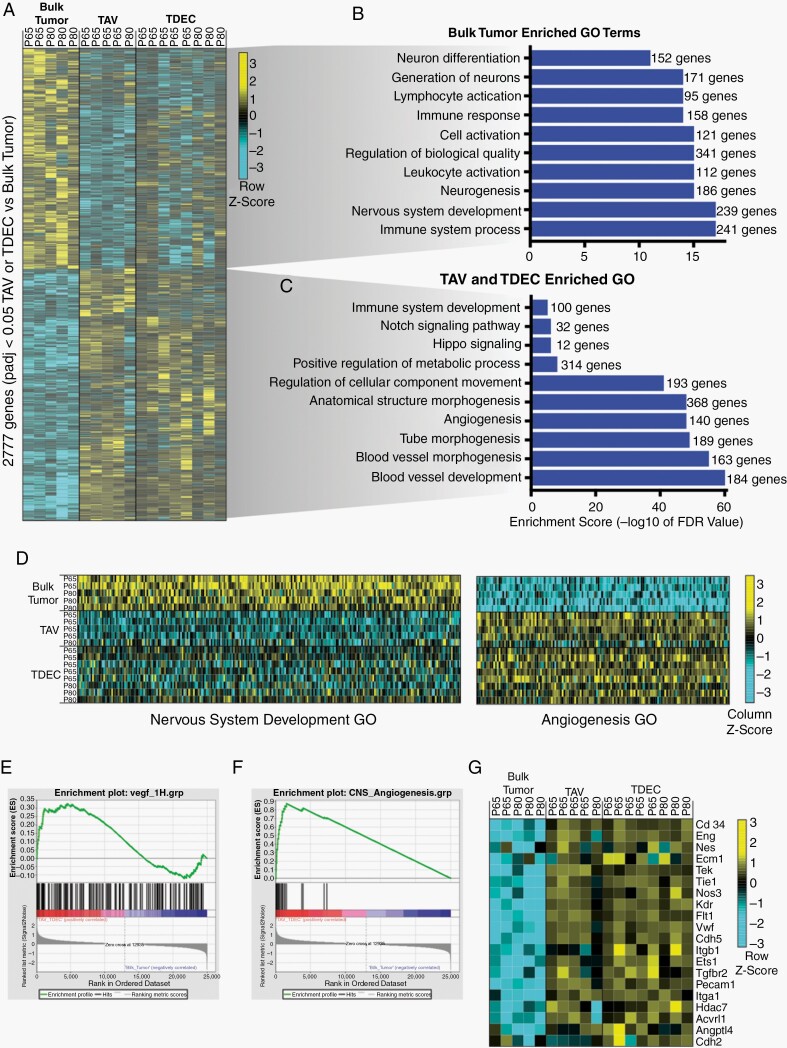
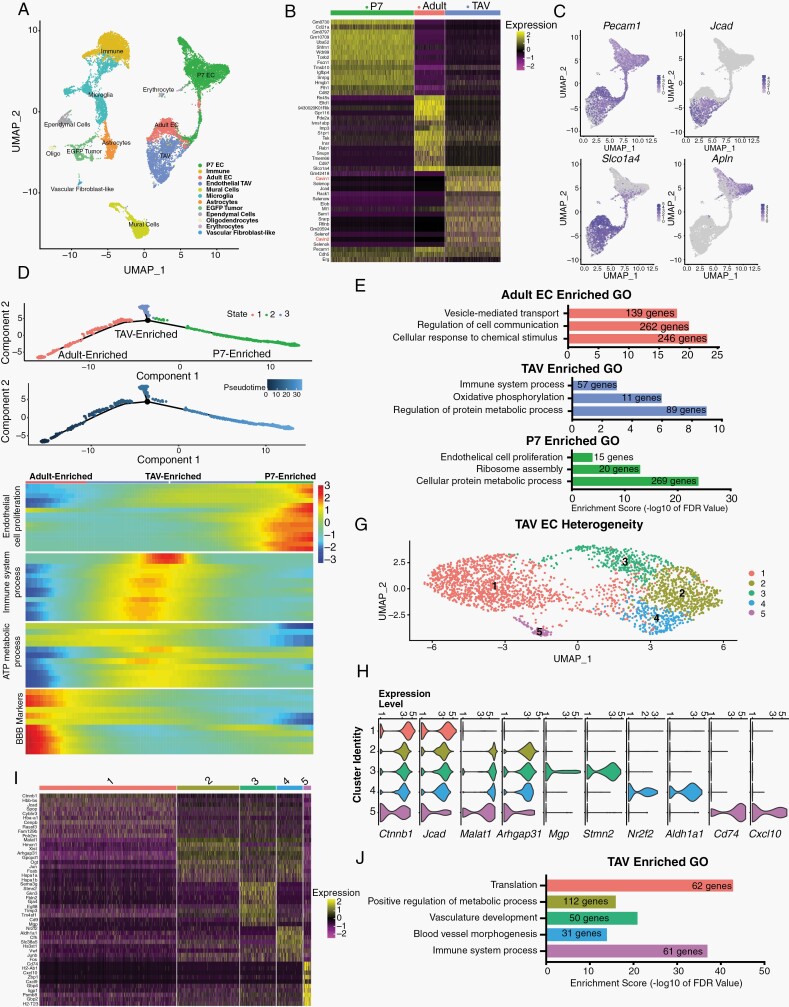
Results: Using a mouse model of glioma, we identified progressive alteration of vessel function and morphogenesis over time. We also showed in our mouse model that TDECs are a rare subpopulation that contributes to vessels within the tumor, albeit to a limited degree. Furthermore, transcriptional profiling demonstrates that both TAVs and TDECs are molecularly distinct, and both populations feature extensive molecular heterogeneity. Finally, the distinct molecular signatures of these heterogeneous populations are also present in human glioma.

Conclusions: Our findings show extensive endothelial heterogeneity within the tumor and tumor microenvironment and provide insights into the diverse cellular and molecular mechanisms that drive glioma vascularization and angiogenesis during tumorigenesis.

Keywords: angiogenesis; glioma; lymphangiogenesis; tumor-associated vessels (TAVs); tumor-derived endothelial cells (TDECs).


Figures

Fig. 1
Fig. 1
Progressive morphological and functional changes in tumor-associated vessels. (A,D) Whole-mount images of an intact mouse brain at P65 (A) or P80 (D), with tumor-derived cells labeled by GFP (magenta), and vessels labeled by fluorescent lectin (teal). The yellow boxed area in (A,D), after CLARITY-based tissue clearing and lightsheet confocal imaging, is magnified and shows (B,E) vessels and tumor together or (B′,E′) tumor alone. The yellow boxed area in (B,E) is magnified and shows (C,F) vessels and tumor and (C′,F′) tumor alone. White arrows denote vessels (teal) that are associated with tumors (magenta), denoted by asterisks. Yellow carets in (E′) denote GFP+ vessel-like tubes. Scale bar in A, B, B′, D, E, and E′ = 2 mM. Scale bar in C, C′, F, and F′ = 300 µm. (G-I) Quantification of vessel morphology at P65 and P80 for tumor-associated vasculature (TAV) and the contralateral non-tumor region. (J-M) Whole-mount and phase images show brain tumor progression from P65 (J, K) to P80 (L, M). Matching images of each brain following intravenous injection of Evans blue dye. (N) Quantification of Evans blue dye leak, as determined by the ratio of absorbance at OD620-405 nm per milligram of tissue from the tumor area of a contralateral region from the same brain.
Fig. 2
Fig. 2
Tumor-derived endothelial cells are present in the native mouse model of glioma. (A) Whole mount reconstruction of a lightsheet confocal image from a P80 tumor-containing brain. The boxed area in (A) is magnified and shown in (B) with vessels (left), tumor cells (middle), and merged (right). White arrows denote vessels, yellow carets denote GFP+-positive vessels. (C) Reconstructions of 40 µm thick sections from fluorescent lectin (turquoise) perfused P80 tumors (magenta) stained with CD31 (green) and DAPI (pseudo yellow) in individual and merged channels. Red arrows indicate lumen of perfused vessels, white arrows indicates tumor-derived cells (magenta) positive for CD31 (green). Boxed area is magnified in (D), showing tumor-derived cells (white arrow, magenta) enwrapping a perfused vessel (red arrow, teal). The upper panel shows a longitudinal view and the lower panel is rotated 90 degrees to show cross section view of the vessel, X-Y-Z axis is indicated. (E) Representative FACS plot from a P65 brain shows GFP+ tumor-derived cells co-express the endothelial marker CD31 (TDECs). (F) Quantification of murine TAVs (CD31+, GFP) and TDECs (GFP+, CD31+) at P65 and P80. (G) Glioma neurospheres produce tube-like structures when cultured in endothelial growth media (EGM), DFO, and grown in Matrigel. Scale bars = 20 µm. (H) Representative FACS plots of tumor neurospheres sorted for GFP+ and CD31+ shows co-expression of these two markers; quantification in (I).
Fig. 3
Fig. 3
Tumor-associated vasculature and tumor-derived endothelium are molecularly distinct. (A) Heatmap of differentially expressed genes detected by RNA-seq. Genes enriched are yellow, genes depleted are turquoise. Associated select gene ontology (GO) terms for genes up-regulated in either (B) bulk tumor or (C) TAV and TDEC populations. (D) Heatmap showing the individual genes for the GO categories Nervous System Development and Angiogenesis. (E) Gene Set Expression Analysis (GSEA) shows enrichment of VEGF-induced transcripts in the combined TAV and TDEC populations. (F) GSEA shows enrichment of CNS angiogenic genes in TAV and TDECs. (G) Heatmap of individual genes used for the angiogenic analysis (panel E) depicts their enrichment in the TAV and TDEC populations and depletion from bulk tumor.
Fig. 4
Fig. 4
TAVs display extensive cellular heterogeneity and are not simply angiogenic adult endothelium. (A) UMAP representation of scRNA-seq individual transcriptomes from wildtype P7, adult brain endothelial cells, and P80 tumor-bearing brains; each population is color-coded according to their identity (determined by cell-type specific markers). The corresponding number of cells per cluster is shown in parenthesis. (B) Heatmap showing the top 15 gene markers for each unique endothelial cell cluster. (C) Population marker expression superimposed on only the three endothelial datasets (P7, adult, and TAV). (D) Monocle trajectory analysis of P7 brain ECs, adult brain ECs, and P80 TAVs. (E) GO terms associated with enriched transcripts detected in each cell state, from panel (D). (F) Trajectory heatmap showing dynamic gene expression changes between the endothelial clusters (TAV, Adult, and P7 ECs) plotted along pseudotime as determined by Monocle trajectory analysis from panel (E). (G) UMAP representation of scRNA-seq individual transcriptomes from P80 TAVs identifies 5 unique populations, each color-coded according to their unique identity. (H) Violin plots show gene expression between the 5 different TAV clusters. (I) Heatmap of the top 10 differentially expressed genes between each population. (J) GO terms for enriched transcripts specific to each TAV population.
Fig. 5
Fig. 5
Murine glioma TDECs are comprised of molecularly and cellularly unique subpopulations. (A) Heatmap of differentially expressed genes in TAVs and TDECs. Genes enriched are indicated in yellow, genes depleted are turquoise. (B) Select gene ontology (GO) terms for genes up-regulated in TDEC populations are shown. (C) Heatmap showing individual genes for the GO category Positive Regulation of Cell Migration. (D) Principal component analysis of bulk RNA-Seq shows that TDEC transcriptomes segregate into 2 groups. (E) Heatmap of differentially expressed genes detected by RNA-seq shows Group 1 (n = 4) and Group 2 (n = 4) TDECs feature distinct signatures. (F) GO terms for select genes up-regulated in TDEC Group1 and Group 2 populations. (G) Schematic illustrating the strategy for isolating TDBECs from mouse glioma. (H) Representative FACS plots demonstrating the isolation of TDBEC and TDLEC populations. (I) Representative image stream analysis demonstrating expression of GFP and CD31 in TDBECs and (J) GFP, CD31, PDNP, and FLT4 in TDLECs. (K) Quantification of TDBECs and TDLECs to the total TDEC population. (L) A heatmap of differentially expressed genes in TDBECs and TDLECs. (M) Associated select GO terms for genes up-regulated in bulk tumor, TDBEC, or TDLEC populations. (N) Heatmap of select genes upregulated in murine blood lymphatic (TDLECs) versus blood endothelial cells (TDBECs).
Fig. 6
Fig. 6
TDEC heterogeneity is conserved in a human xenograft model of glioma. (A) Schematic of TDBECs and TDLECs FACS isolation from PDOX model. (B) FACS plots demonstrating isolation of human TDBEC and TDLEC cell populations from PDOX. (C) Image stream analysis demonstrating protein expression of GFP and CD31 TDBECs. (D) Image stream analysis demonstrating expression of GFP, CD31, PDNP, and FLT4 TDLECs. (E) Quantification of TDBECs and TDLECs relative to the entire TDEC population. (F) Heatmap of differentially expressed genes in PDOX TDBECs and PDOX TDLECs. (G) Select GO terms up-regulated in either human TDLEC or human TDBEC populations. (H) Heatmap depicting conserved upregulation of lymphatic endothelial transcripts in PDOX TDLECs and blood endothelial transcripts in PDOX TDBECs. (I) Heatmap showing enrichment of blood endothelial cell and lymphatic transcripts in high-grade human glioma (n = 154) compared to low-grade glioma (LGC) (n = 516) as determined by RNA-seq data from TCGA.

Comment in

References

    1. Semrad TJ, O’Donnell R, Wun T, et al. . Epidemiology of venous thromboembolism in 9489 patients with malignant glioma. J Neurosurg. 2007;106(4):601–608. - PubMed
    1. Jain RK, di Tomaso E, Duda DG, Loeffler JS, Sorensen AG, Batchelor TT. Angiogenesis in brain tumours. Nat Rev Neurosci. 2007;8(8):610–622. - PubMed
    1. Bergers G, Hanahan D. Modes of resistance to anti-angiogenic therapy. Nat Rev Cancer. 2008;8(8):592–603. - PMC - PubMed
    1. Kalpathy-Cramer J, Chandra V, Da X, et al. . Phase II study of tivozanib, an oral VEGFR inhibitor, in patients with recurrent glioblastoma. J Neurooncol. 2017;131(3):603–610. - PMC - PubMed
    1. Xue W, Du X, Wu H, et al. . Aberrant glioblastoma neovascularization patterns and their correlation with DCE-MRI-derived parameters following temozolomide and bevacizumab treatment. Sci Rep. 2017;7(1):13894. - PMC - PubMed

Publication types