. 2021 Jan 25;49(2):657-673.
doi: 10.1093/nar/gkaa1235.

The atlas of RNase H antisense oligonucleotide distribution and activity in the CNS of rodents and non-human primates following central administration

Affiliations

The atlas of RNase H antisense oligonucleotide distribution and activity in the CNS of rodents and non-human primates following central administration

Paymaan Jafar-Nejad et al. Nucleic Acids Res. .

Abstract

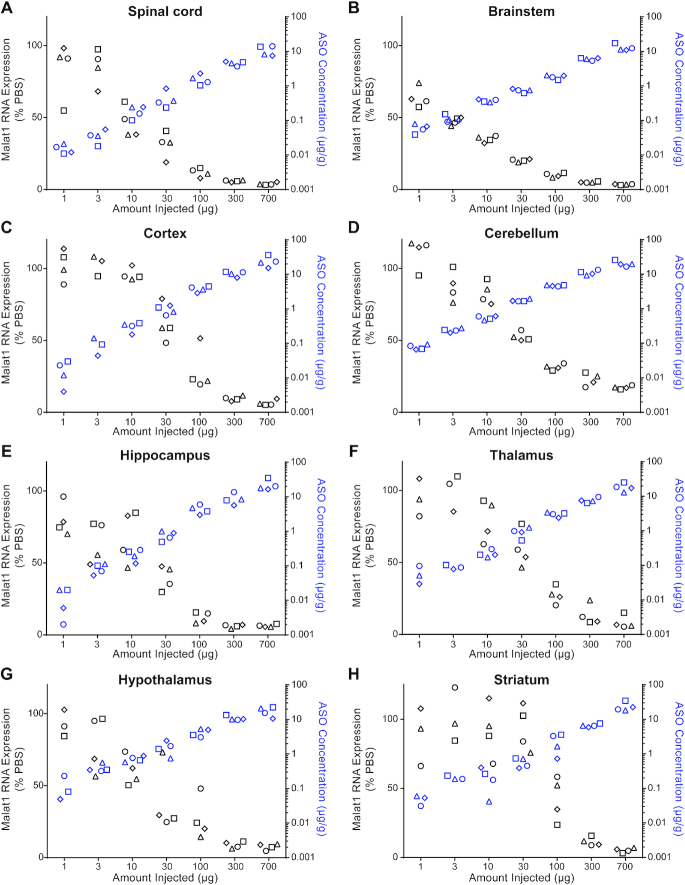
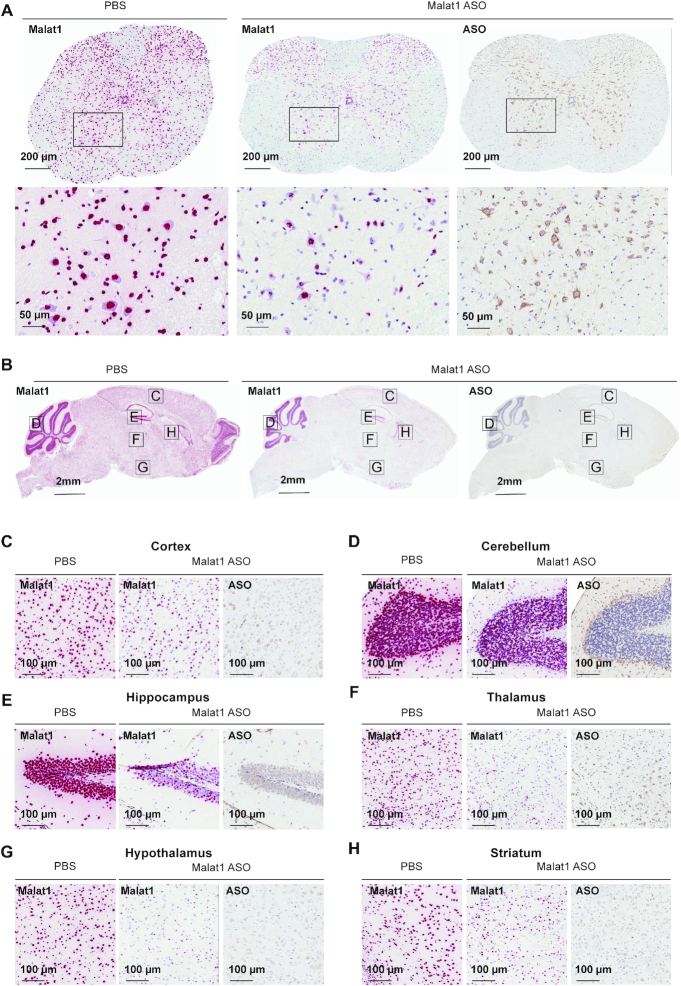
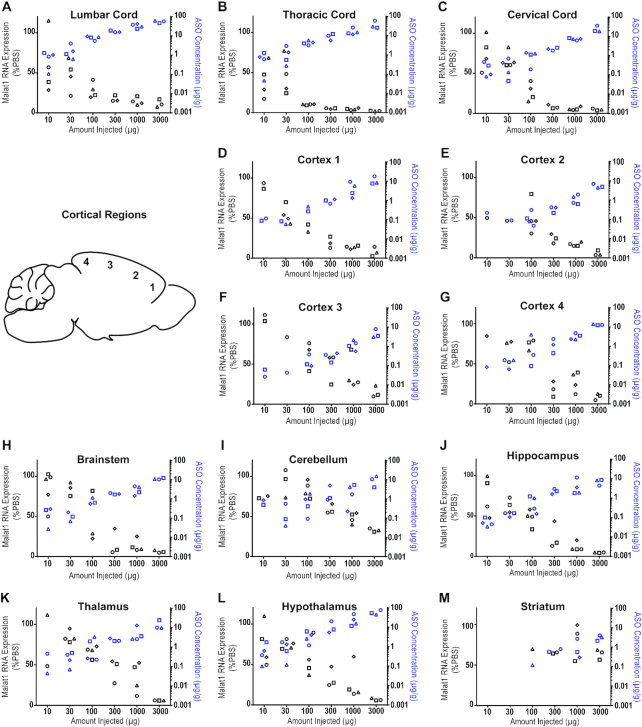
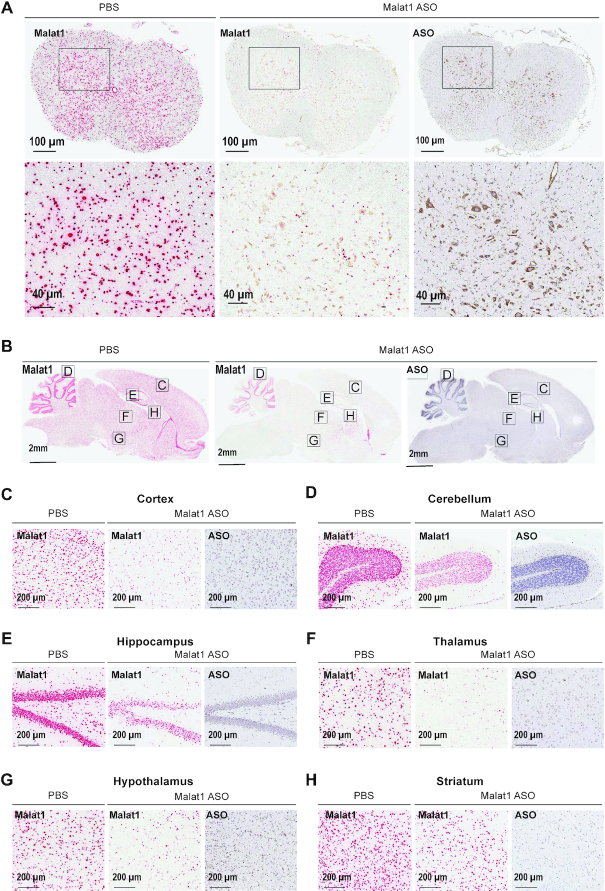
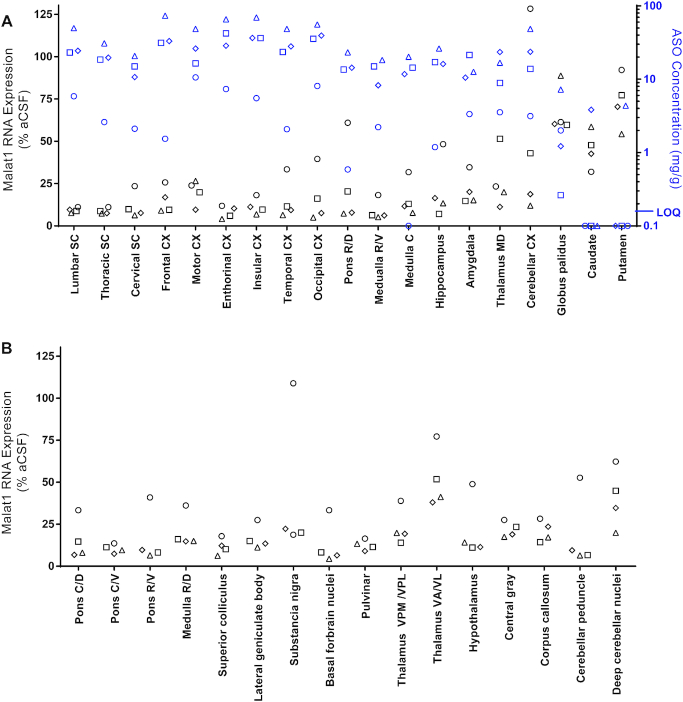
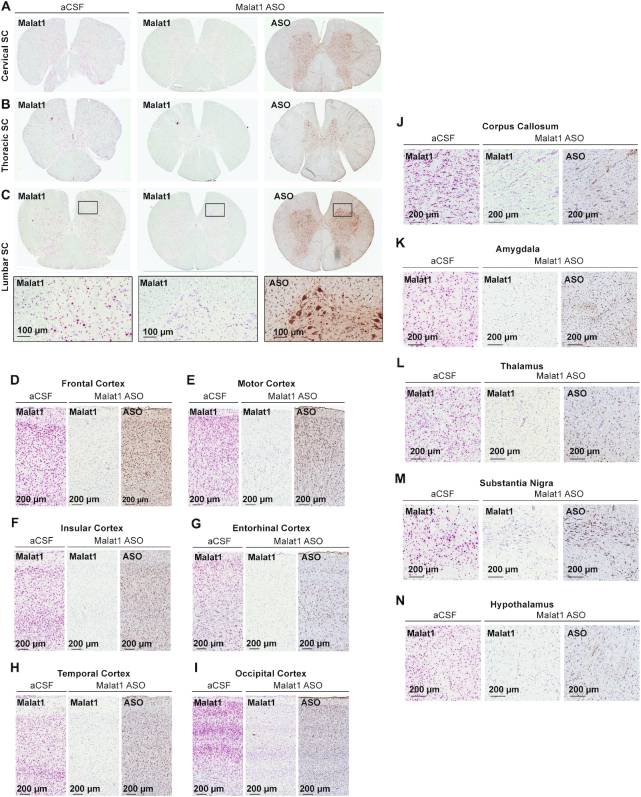
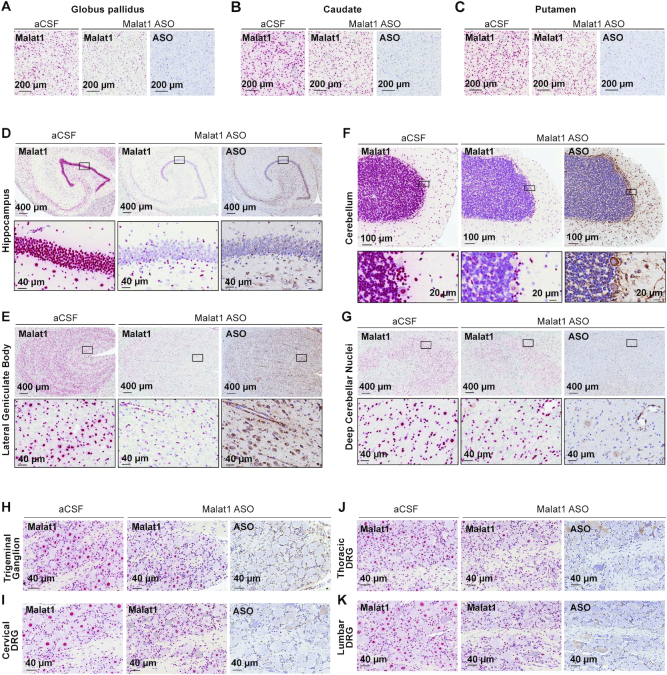
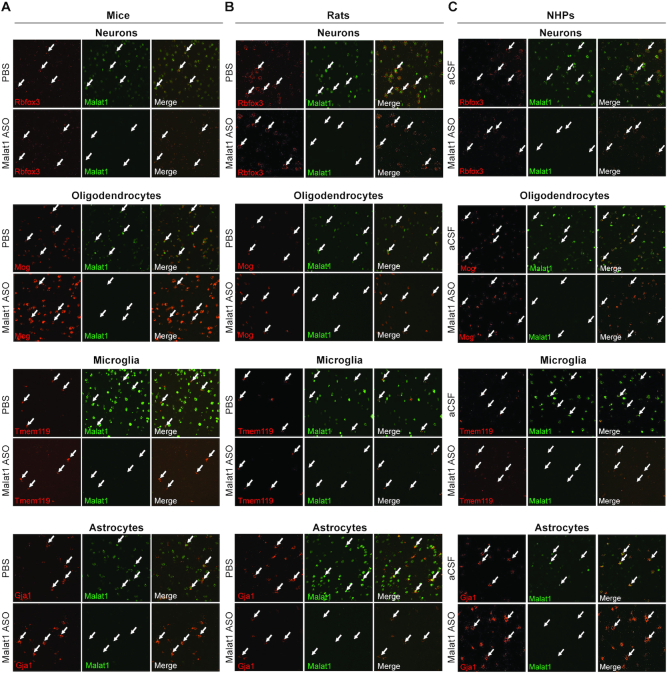
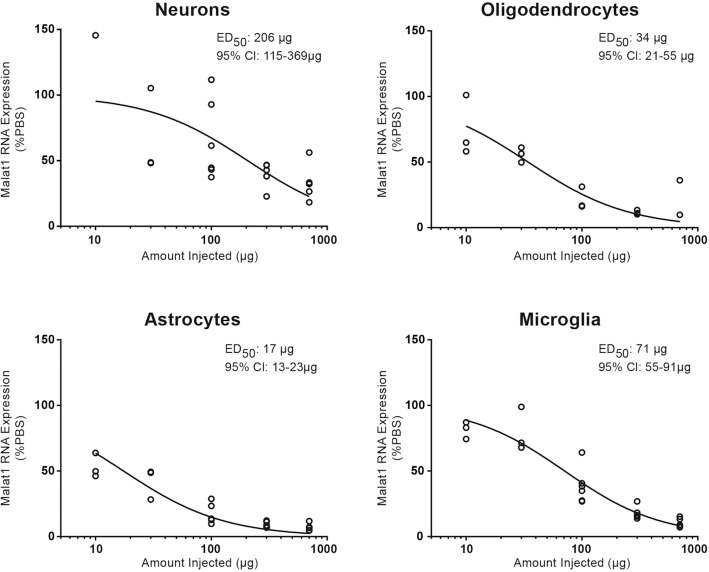
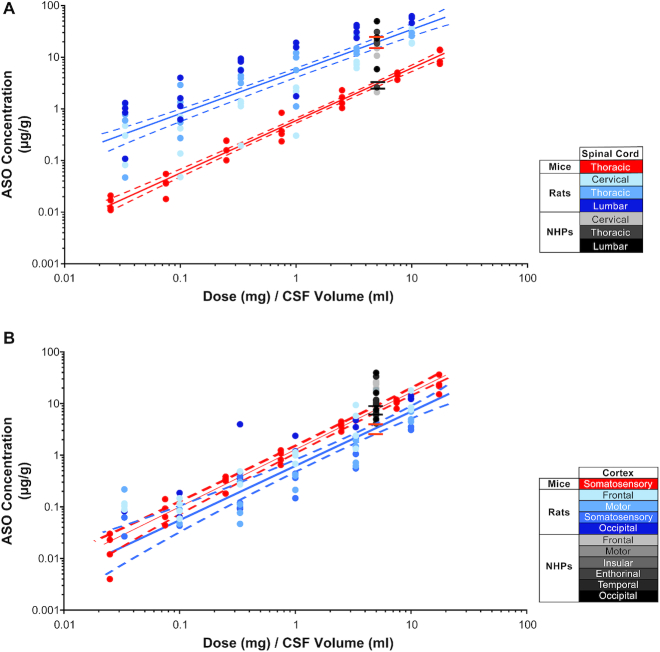
Antisense oligonucleotides (ASOs) have emerged as a new class of drugs to treat a wide range of diseases, including neurological indications. Spinraza, an ASO that modulates splicing of SMN2 RNA, has shown profound disease modifying effects in Spinal Muscular Atrophy (SMA) patients, energizing efforts to develop ASOs for other neurological diseases. While SMA specifically affects spinal motor neurons, other neurological diseases affect different central nervous system (CNS) regions, neuronal and non-neuronal cells. Therefore, it is important to characterize ASO distribution and activity in all major CNS structures and cell types to have a better understanding of which neurological diseases are amenable to ASO therapy. Here we present for the first time the atlas of ASO distribution and activity in the CNS of mice, rats, and non-human primates (NHP), species commonly used in preclinical therapeutic development. Following central administration of an ASO to rodents, we observe widespread distribution and target RNA reduction throughout the CNS in neurons, oligodendrocytes, astrocytes and microglia. This is also the case in NHP, despite a larger CNS volume and more complex neuroarchitecture. Our results demonstrate that ASO drugs are well suited for treating a wide range of neurological diseases for which no effective treatments are available.


Figures

Figure 1.
Figure 1.
Dose responsive Malat1 RNA reduction and ASO accumulation in mouse CNS tissue. Real-time RT-PCR analysis and the Malat1 ASO tissue concentration (black and blue symbols respectively) are plotted for each animal in each dose for (A) spinal cord, (B) brainstem, (C) cortex, (D) cerebellum, (E) hippocampus, (F) thalamus, (G) hypothalamus and (H) striatum. Malat1 ASO concentrations for all CNS regions for the doses 1, 3, 10 and 30 μg were measured by HELISA and for the doses 100, 300 and 700 μg were measured by LC/MS. The left Y axis is for RNA levels which are plotted as % PBS control and the right Y axis is for ASO concentrations which are plotted as μg ASO per gram of tissue. PBS, phosphate-buffered saline.
Figure 2.
Figure 2.
Widespread ASO distribution and Malat1 RNA reduction in mouse CNS. (A) spinal cord, (B) brain, (C) cortex, (D) cerebellum, (E) hippocampus, (F) thalamus, (G) hypothalamus and (H) striatum were stained for Malat1 RNA and ASO. Staining, treatment, and the scales are indicated. All sections were counter stained with hematoxylin. Mice were treated with 300 μg Malat1 ASO or PBS. IHC, immunohistochemistry; ISH in situ hybridization; PBS, phosphate-buffered saline.
Figure 3.
Figure 3.
Dose responsive Malat1 RNA reduction and ASO accumulation in rat CNS tissue. Real-time RT-PCR analysis and the Malat1 ASO tissue concentration (black and blue symbols respectively) are plotted for each animal in each dose for spinal cord (A) lumbar, (B) thoracic and (C) cervical (D–G) cortex regions 1–4, (H) brainstem, (I) cerebellum, (J) hippocampus, (K) thalamus, (L) hypothalamus and (M) striatum. Malat1 ASO concentrations for all CNS regions for all doses were measured by LC/MS. The left Y axis is for RNA levels which are plotted as % PBS control and the right Y axis is for ASO concentrations which are plotted as μg ASO per gram of tissue. PBS, phosphate-buffered saline.
Figure 4.
Figure 4.
Widespread ASO distribution and Malat1 RNA reduction in rat CNS. (A) spinal cord, (B) brain, (C) cortex, (D) cerebellum, (E) hippocampus, (F) thalamus, (G) hypothalamus and (H) striatum were stained for Malat1 RNA and ASO. Staining, treatment and the scales are indicated. All sections were counter stained with hematoxylin. Rats were treated with 1000 μg Malat1 ASO or PBS. IHC, immunohistochemistry; ISH in situ hybridization; PBS, phosphate-buffered saline.
Figure 5.
Figure 5.
Widespread ASO accumulation and Malat1 RNA reduction in the non-human primate (NHP) CNS. (A) Real-time RT-PCR analysis and the Malat1 ASO tissue concentration (black and blue symbols respectively) are plotted for each animal in several CNS regions. Malat1 ASO concentrations for all CNS regions for all doses were measured by LC/MS. The left Y axis is for RNA levels which are plotted as % vehicle control and the right Y axis is for ASO concentrations which are plotted as μg ASO per gram of tissue. (B) Real-time RT-PCR analysis for additional CNS regions that were too small to be sampled for ASO concentration analysis. RNA levels are plotted for each animal as % vehicle control. aCSF, artificial cerebrospinal fluid.
Figure 6.
Figure 6.
Widespread ASO distribution and Malat1 RNA reduction in the non-human primate (NHP) CNS. (A) cervical, (B) thoracic, and (C) lumbar spinal cord, (D) frontal, (E) motor, (F) insular, (G) entorhinal, (H) temporal, (I) occipital cortex, (J) corpus callosum, (K) amygdala, (L) thalamus, (M) substantia nigra and (N) hypothalamus.
Figure 7.
Figure 7.
Widespread ASO distribution and Malat1 RNA reduction in the non-human primate (NHP) CNS. (A) globus pallidus, (B) caudate, (C) putamen, (D) hippocampus, (E) lateral geniculate body, (F) cerebellum, (G) deep cerebellar nuclei, (H) trigeminal ganglion, (I) cervical, (J) thoracic and (K) lumbar dorsal root ganglia are stained for Malat1 RNA and ASO. Staining, treatment, and the scales are indicated. All sections were counter stained with hematoxylin. DRG, dorsal root ganglia. IHC, immunohistochemistry; ISH, in situ hybridization; aCSF, artificial cerebrospinal fluid.
Figure 8.
Figure 8.
The Malat1 ASO targets all major cell types in the CNS. Colocalization of Malat1 with Rbfox3 in neurons, Mog in oligodendrocytes, Tmem119 in microglia, and Gj1 in astrocytes in cortex of (A) mouse, (B) rat and (C) non-human primates (NHP). Arrows indicate four selected cells in each field. Mice were treated with 300 μg Malat1 ASO or vehicle. Rats were treated with 1000 μg Malat1 ASO or vehicle. NHP were treated with three doses of 25 mg Malat1 ASO or vehicle.
Figure 9.
Figure 9.
Dose-dependent Malat1 RNA reduction in neurons, oligodendrocytes, astrocytes and microglia isolated from mouse cortex. Real-time RT-PCR analysis for Malat1 RNA are plotted for individual animals in different cell types. Injected doses are indicated on the X axis.
Figure 10.
Figure 10.
Comparison of ASO tissue concentration after dose normalized to CSF volume in mice, rats and non-human primates (NHPs) in (A) spinal cord and (B) cortex. The CSF volumes used for mouse, rat and NHP were 0.04, 0.3 and 15 ml, respectively. Data for mice, rats and NHPs are shown in red, blue and gray symbols, respectively. Different tissues sampled from rats and NHPs are depicted in shades of blue and gray, respectively. The best fit regression is shown as a in solid line (red for mice and blue for rats) and the 95% confidence intervals are shown as dashed lines. The predicted NHP tissue concentrations simulated form boot strap regression for mouse (between the black lines) or rat (between the orange lines) are shown.

References

    1. Crooke S.T., Witztum J.L., Bennett C.F., Baker B.F.. RNA-targeted therapeutics. Cell Metab. 2019; 29:501. - PubMed
    1. Wu H., Lima W.F., Zhang H., Fan A., Sun H., Crooke S.T.. Determination of the role of the human RNase H1 in the pharmacology of DNA-like antisense drugs. J. Biol. Chem. 2004; 279:17181–17189. - PubMed
    1. Bennett C.F., Swayze E.E.. RNA targeting therapeutics: molecular mechanisms of antisense oligonucleotides as a therapeutic platform. Annu. Rev. Pharmacol. Toxicol. 2010; 50:259–293. - PubMed
    1. Wahlestedt C., Golanov E., Yamamoto S., Yee F., Ericson H., Yoo H., Inturrisi C.E., Reis D.J.. Antisense oligodeoxynucleotides to NMDA-R1 receptor channel protect cortical neurons from excitotoxicity and reduce focal ischaemic infarctions. Nature. 1993; 363:260–263. - PubMed
    1. Weiss B., Zhou L.W., Zhang S.P., Qin Z.H.. Antisense oligodeoxynucleotide inhibits D2 dopamine receptor-mediated behavior and D2 messenger RNA. Neuroscience. 1993; 55:607–612. - PubMed

MeSH terms