. 2021 Mar 29;223(6):971-980.
doi: 10.1093/infdis/jiaa788.

Severe Acute Respiratory Syndrome Coronavirus 2 Serosurveillance in a Patient Population Reveals Differences in Virus Exposure and Antibody-Mediated Immunity According to Host Demography and Healthcare Setting

Affiliations

Severe Acute Respiratory Syndrome Coronavirus 2 Serosurveillance in a Patient Population Reveals Differences in Virus Exposure and Antibody-Mediated Immunity According to Host Demography and Healthcare Setting

Ellen C Hughes et al. J Infect Dis. .

Abstract

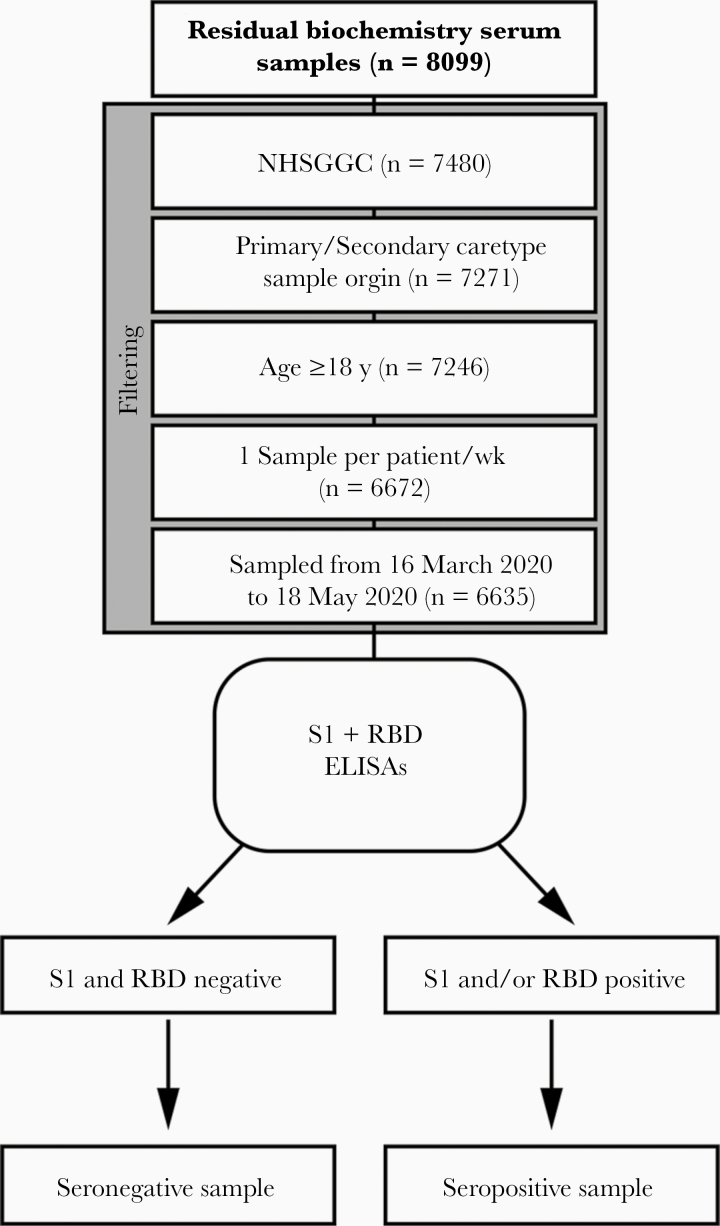
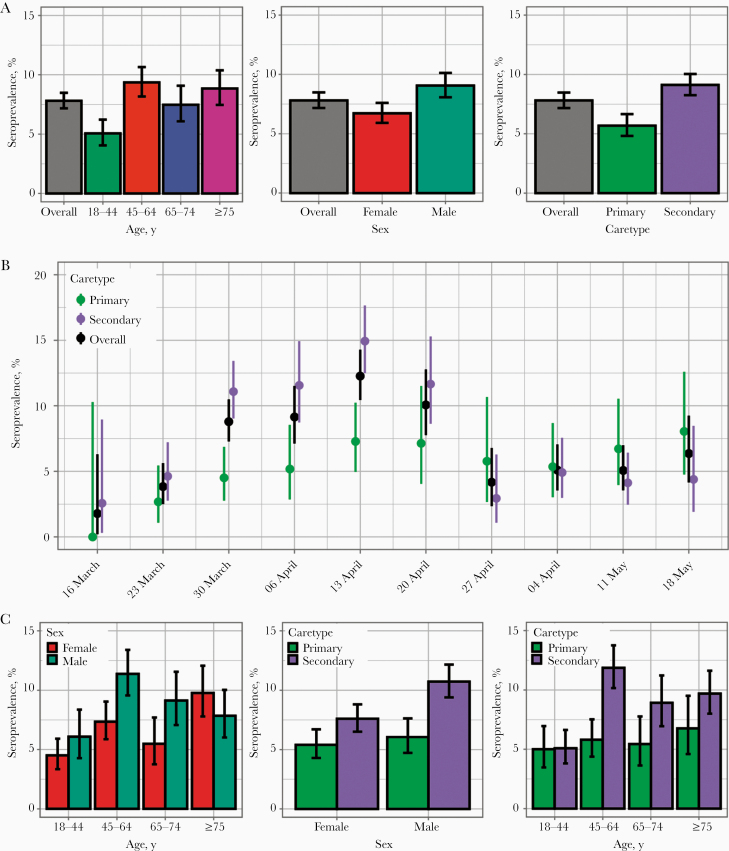
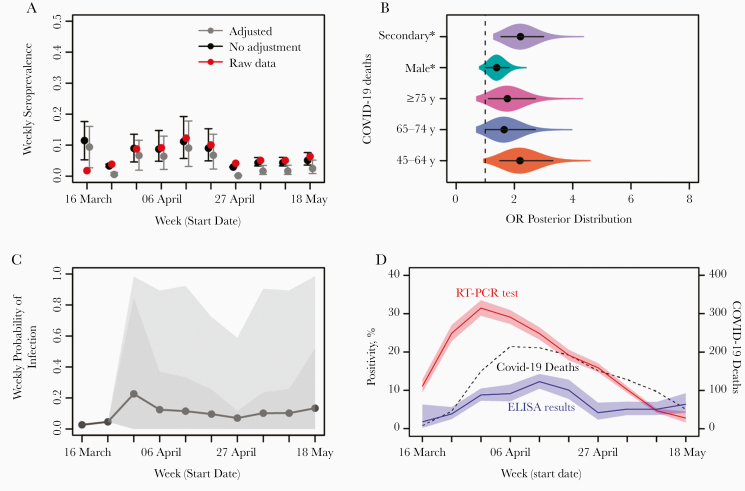
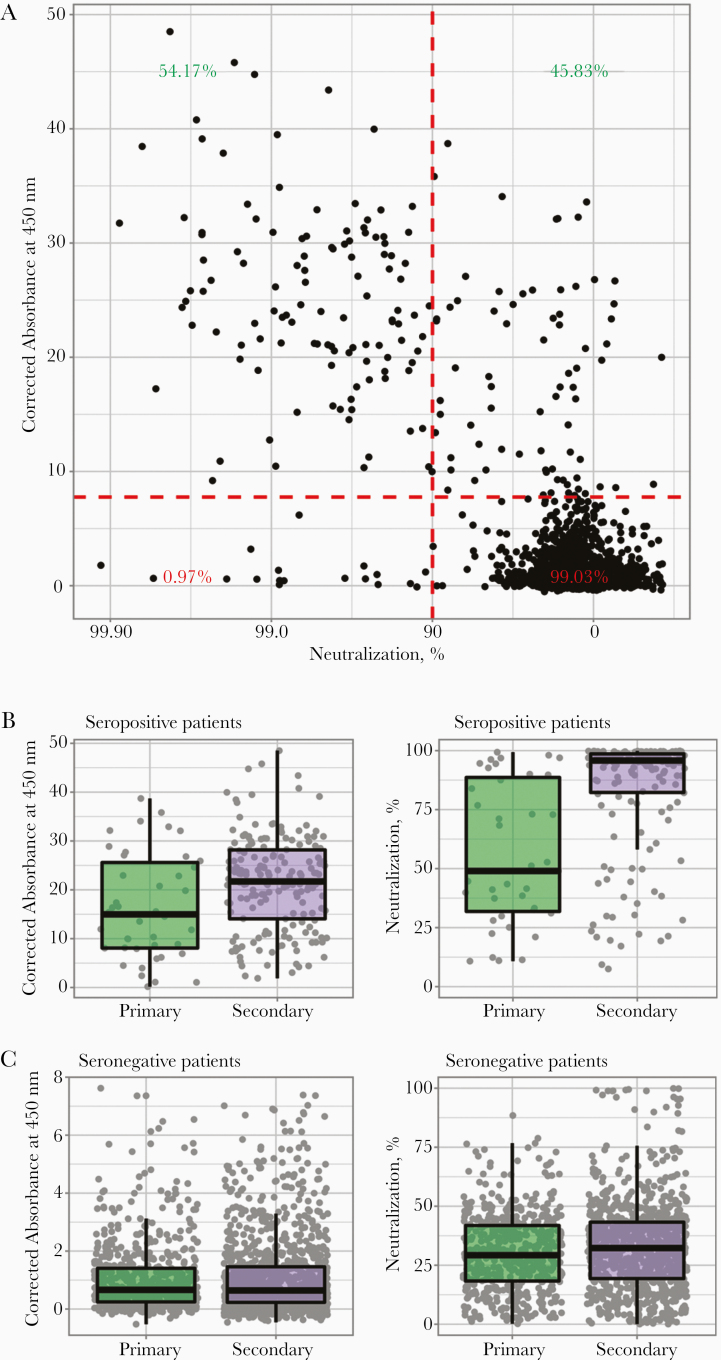
Identifying drivers of severe acute respiratory syndrome coronavirus 2 (SARS-CoV-2) exposure and quantifying population immunity is crucial to prepare for future epidemics. We performed a serial cross-sectional serosurvey throughout the first pandemic wave among patients from the largest health board in Scotland. Screening of 7480 patient serum samples showed a weekly seroprevalence ranging from 0.10% to 8.23% in primary and 0.21% to 17.44% in secondary care, respectively. Neutralization assays showed that highly neutralizing antibodies developed in about half of individuals who tested positive with enzyme-linked immunosorbent assay, mainly among secondary care patients. We estimated the individual probability of SARS-CoV-2 exposure and quantified associated risk factors. We show that secondary care patients, male patients, and 45-64-year-olds exhibit a higher probability of being seropositive. The identification of risk factors and the differences in virus neutralization activity between patient populations provided insights into the patterns of virus exposure during the first pandemic wave and shed light on what to expect in future waves.

Keywords: COVID-19; SARS-CoV-2; modelling; risk factors; serology; seroprevalence; virus exposure; virus neutralization.


Figures

Figure 1.
Figure 1.
Diagram summarizing the flow of samples used in this study. Abbreviations: ELISAs, enzyme-linked immunosorbent assays; NHSGGC, NHS Greater Glasgow and Clyde; RBD, receptor-binding domain; S1, spike glycoprotein.
Figure 2.
Figure 2.
Unadjusted severe acute respiratory syndrome coronavirus 2 (SARS-CoV-2) seroprevalence in NHS Greater Glasgow and Clyde, Scotland, United Kingdom, patient population. A, B, Seroprevalence estimates and 95% confidence intervals are shown across age groups, sex. and healthcare setting (A), or date of sampling (B). C, Seroprevalence estimates and 95% confidence intervals investigated in sequential combinations of age group, sex, and healthcare setting.
Figure 3.
Figure 3.
Posterior estimates obtained from the bayesian state-space model. A, Model fit (observed data in red vs estimated unadjusted seroprevalence in black) and estimated adjusted seroprevalence (gray). B, Odds ratios (ORs) of the effect sizes of age, sex and healthcare setting on the probability of a patient being seropositive for severe acute respiratory syndrome coronavirus 2 (SARS-CoV-2) antibodies (95% confidence interval [CI] lines within violin). C, Estimated mean weekly probability of infection of the studied population, and associated 75% and 95% CIs. D, Unadjusted SARS-CoV-2 seroprevalence (blue), reverse-transcription polymerase chain reaction (RT-PCR)–confirmed coronavirus disease 2019 (COVID-19) cases (red), and COVID-19–related deaths (black) are shown. Abbreviation: ELISA, enzyme-linked immunosorbent assay.
Figure 4.
Figure 4.
Antibody levels and subsequent virus neutralization activity suggest an association with disease severity. A, Correlation between virus neutralization and antibody production is shown as a scatterplot, where every sample is represented by a black dot. Percentages reflect the sample distribution among seropositive patients (green numbers) and seronegative patients (red numbers), and between low (right) and high (left) virus neutralization. Enzyme-linked immunosorbent assay corrected-absorbance (left) and virus neutralisation (right) values are shown in patients seropositive B or seronegative C for acute respiratory syndrome coronavirus 2.

References

    1. Coronavirus (COVID-19): Scotland’s route map. https://www.gov.scot/collections/coronavirus-covid-19-scotlands-route-map/. Accessed .
    1. Winter AK, Hegde ST. The important role of serology for COVID-19 control. Lancet Infect Dis 2020; 20:758–9. - PMC - PubMed
    1. Zhao J, Yuan Q, Wang H, et al. Antibody responses to SARS-CoV-2 in patients with novel coronavirus disease 2019. Clin Infect Dis 2020; 71:2027–34. - PMC - PubMed
    1. Hyseni I, Molesti E, Benincasa L, et al. Characterisation of SARS-CoV-2 lentiviral pseudotypes and correlation between pseudotype-based neutralisation assays and live virus-based micro neutralisation assays. Viruses 2020; 12:1011. - PMC - PubMed
    1. World Health Organization. Establishment of the WHO International Standard and Reference Panel for anti-SARS-CoV-2 antibody. https://www.who.int/publications/m/item/WHO-BS-2020.2403. Accessed 18 November 2020.

Publication types

MeSH terms