

Novel PI3K/Akt/mTOR signaling inhibitor, W922, prevents colorectal cancer growth via the regulation of autophagy
- PMID: 33367926
- PMCID: PMC7721087
- DOI: 10.3892/ijo.2020.5151
Novel PI3K/Akt/mTOR signaling inhibitor, W922, prevents colorectal cancer growth via the regulation of autophagy
Abstract
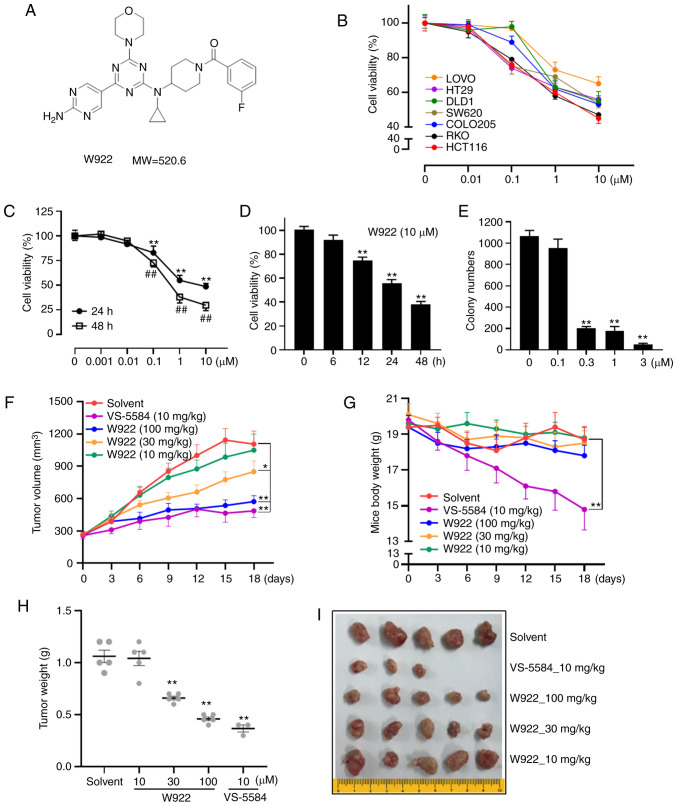
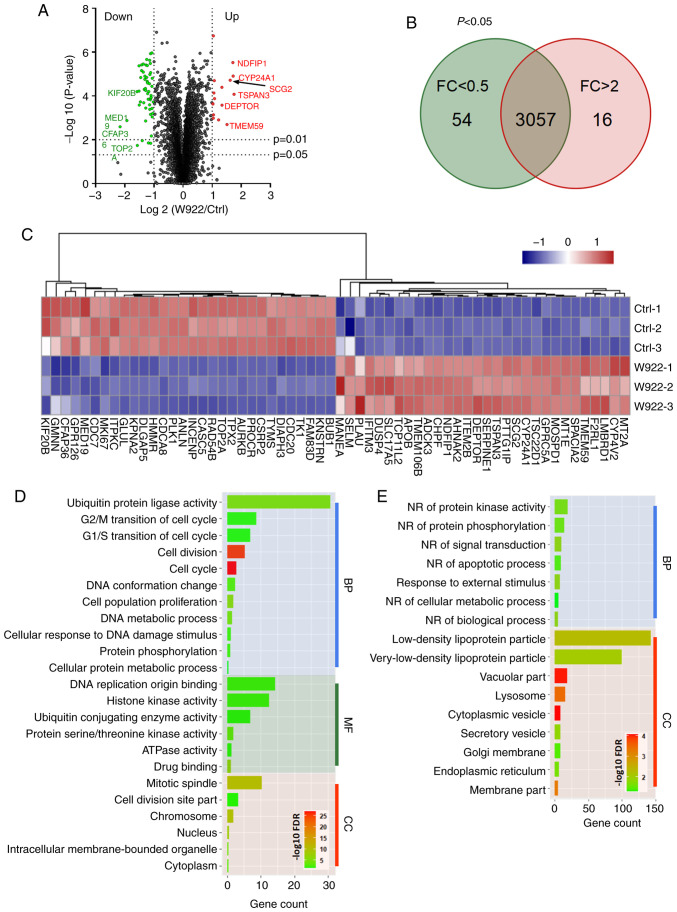
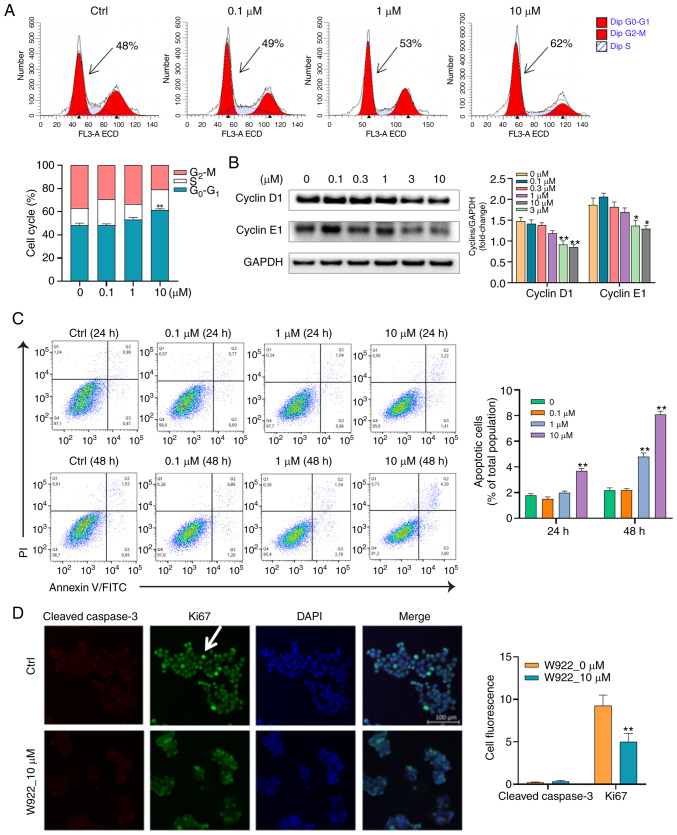
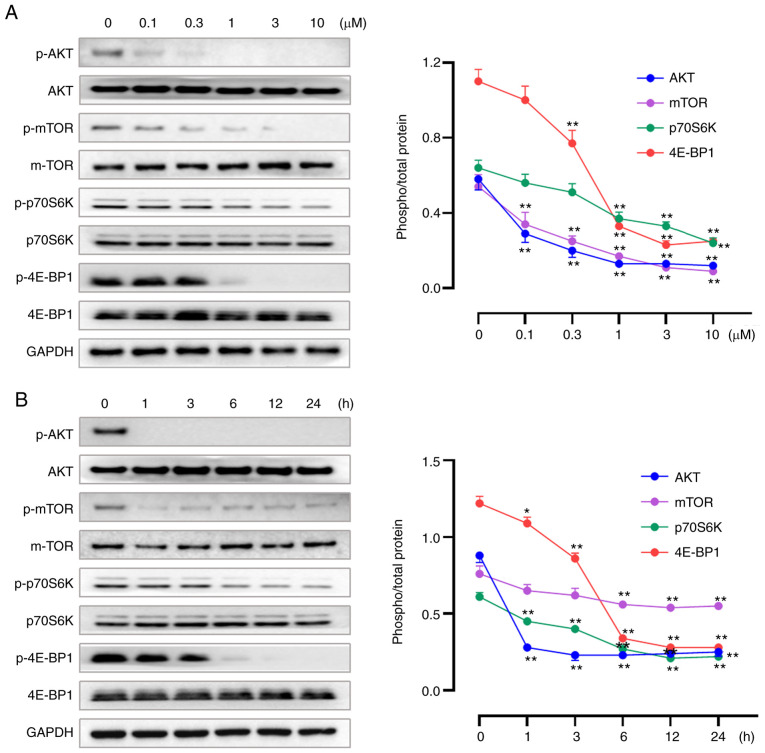
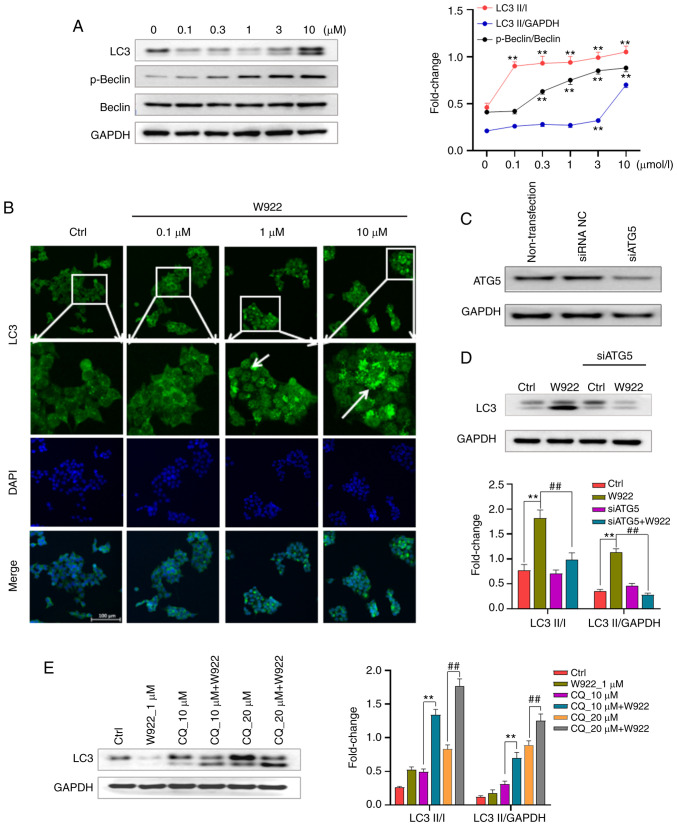
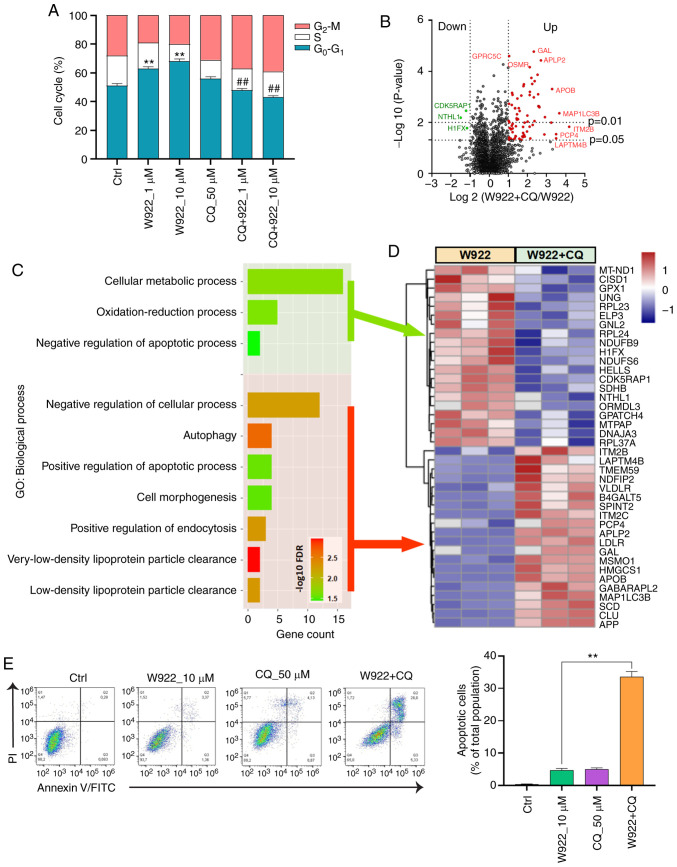
W922, a novel PI3K/Akt/mTOR pathway inhibitor, exhibits efficient anti‑tumor effects on HCT116, MCF‑7 and A549 human cancer cells compared with other synthesized compounds. The present study aimed to investigate its anti‑tumor effects on colorectal cancer cells. A total, of seven different colorectal cell lines were selected to test the anti‑proliferation profile of W922, and HCT116 was found to be the most sensitive cell line to the drug treatment. W922 inhibited HCT116 cell viability and cell proliferation in vitro in concentration‑ and time‑dependent manners. Furthermore, W922 suppressed the tumor growth in a xenograft mouse model and exhibited low toxicity. The proteomic alterations in W922‑treated HCT116 cells were found to be associated with cell cycle arrest, negative regulation of signal transduction and lysosome‑related processes. W922 caused cell cycle arrest of HCT116 cells in G0‑G1 phase, but only triggered slight apoptosis. In addition, the PI3K/Akt/mTOR signaling proteins were dephosphorylated upon W922 treatment. It has been reported that inhibition of mTOR is relevant to autophagy, and the present results also indicated that W922 was involved in autophagy induction. An autophagy inhibitor, chloroquine, was used to co‑treat HCT116 cells with W922, and it was identified that the cell cycle arrest was impaired. Moreover, co‑treatment of W922 and chloroquine led to a significant population of apoptotic cells, thus providing a promising therapeutic strategy for colorectal cancer.
Keywords: W922; PI3K/Akt/mTOR inhibitor; colorectal cancer; cell cycle arrest; autophagy.
Figures
Similar articles
-
KW2478 and Cisplatin Synergistically Anti-colorectal Cancer by Targeting PI3K/AKT/mTOR Pathway.Anticancer Agents Med Chem. 2025;25(11):800-810. doi: 10.2174/0118715206356311241128075924. Anticancer Agents Med Chem. 2025. PMID: 39817393
-
Inhibition of Autophagy Increases Proliferation Inhibition and Apoptosis Induced by the PI3K/mTOR Inhibitor NVP-BEZ235 in Breast Cancer Cells.Clin Lab. 2015;61(8):1043-51. doi: 10.7754/clin.lab.2015.150144. Clin Lab. 2015. PMID: 26427150
-
NVP-BEZ235, a novel dual PI3K-mTOR inhibitor displays anti-glioma activity and reduces chemoresistance to temozolomide in human glioma cells.Cancer Lett. 2015 Oct 10;367(1):58-68. doi: 10.1016/j.canlet.2015.07.007. Epub 2015 Jul 15. Cancer Lett. 2015. PMID: 26188279
-
Recent clinical advances in PI3K inhibitors on colorectal cancer.Pharmazie. 2021 Dec 5;76(12):568-573. doi: 10.1691/ph.2021.1820. Pharmazie. 2021. PMID: 34986950 Review.
-
To Investigate the Occurrence and Development of Colorectal Cancer Based on the PI3K/AKT/mTOR Signaling Pathway.Front Biosci (Landmark Ed). 2023 Feb 24;28(2):37. doi: 10.31083/j.fbl2802037. Front Biosci (Landmark Ed). 2023. PMID: 36866550 Review.
Cited by
-
Research on the role and mechanism of the PI3K/Akt/mTOR signalling pathway in osteoporosis.Front Endocrinol (Lausanne). 2025 May 12;16:1541714. doi: 10.3389/fendo.2025.1541714. eCollection 2025. Front Endocrinol (Lausanne). 2025. PMID: 40421249 Free PMC article. Review.
-
Development of novel DNAJB6-KIAA1522-p-mTOR three-protein prognostic prediction models for CRC.Transl Oncol. 2023 Feb;28:101609. doi: 10.1016/j.tranon.2022.101609. Epub 2022 Dec 24. Transl Oncol. 2023. PMID: 36571988 Free PMC article.
-
Chloroquine inhibits salinomycin-induced autophagy for collaborative anticancer effect in breast cancer.Bioimpacts. 2025 May 25;15:30821. doi: 10.34172/bi.30821. eCollection 2025. Bioimpacts. 2025. PMID: 40584899 Free PMC article.
-
Therapeutic strategies of targeting non-apoptotic regulated cell death (RCD) with small-molecule compounds in cancer.Acta Pharm Sin B. 2024 Jul;14(7):2815-2853. doi: 10.1016/j.apsb.2024.04.020. Epub 2024 Apr 24. Acta Pharm Sin B. 2024. PMID: 39027232 Free PMC article. Review.
-
Orosomucoid 1 promotes colorectal cancer progression and liver metastasis by affecting PI3K/AKT pathway and inducing macrophage M2 polarization.Sci Rep. 2023 Aug 28;13(1):14092. doi: 10.1038/s41598-023-40404-1. Sci Rep. 2023. PMID: 37640741 Free PMC article.
References
-
- Dallas NA, Xia L, Fan F, Gray MJ, Gaur P, van Buren G, II, Samuel S, Kim MP, Lim SJ, Ellis LM. Chemoresistant colorectal cancer cells, the cancer stem cell phenotype, and increased sensitivity to insulin-like growth factor-I receptor inhibition. Cancer Res. 2009;69:1951–1957. doi: 10.1158/0008-5472.CAN-08-2023. - DOI - PMC - PubMed
MeSH terms
Substances
LinkOut - more resources
Full Text Sources
Medical
Miscellaneous