. 2021 May;28(3):592-607.
doi: 10.1007/s12282-020-01197-7. Epub 2020 Dec 24.

Differential expression of the BCAT isoforms between breast cancer subtypes

Affiliations

Differential expression of the BCAT isoforms between breast cancer subtypes

Mai Ahmed Shafei et al. Breast Cancer. 2021 May.

Abstract

Background: Biological characterisation of breast cancer subtypes is essential as it informs treatment regimens especially as different subtypes have distinct locoregional patterns. This is related to metabolic phenotype, where altered cellular metabolism is a fundamental adaptation of cancer cells during rapid proliferation. In this context, the metabolism of the essential branched-chain amino acids (BCAAs), catalysed by the human branched-chain aminotransferase proteins (hBCAT), offers multiple benefits for tumour growth. Upregulation of the cytosolic isoform of hBCAT (hBCATc), regulated by c-Myc, has been demonstrated to increase cell migration, tumour aggressiveness and proliferation in gliomas, ovarian and colorectal cancer but the importance of the mitochondrial isoform, hBCATm has not been fully investigated.

Methods: Using immunohistochemistry, the expression profile of metabolic proteins (hBCAT, IDH) was assessed between breast cancer subtypes, HER2 + , luminal A, luminal B and TNBC. Correlations between the percentage and the intensity of protein expression/co-expression with clinical parameters, such as hormone receptor status, tumour stage, lymph-node metastasis and survival, were determined.

Results: We show that hBCATc expression was found to be significantly associated with the more aggressive HER2 + and luminal B subtypes, whilst hBCATm and IDH1 associated with luminal A subtype. This was concomitant with better prognosis indicating a differential metabolic reliance between these two subtypes, in which enhanced expression of IDH1 may replenish the α-ketoglutarate pool in cells with increased hBCATm expression.

Conclusion: The cytosolic isoform of BCAT is associated with tumours that express HER2 receptors, whereas the mitochondrial isoform is highly expressed in tumours that are ER + , indicating that the BCAT proteins are regulated through different signalling pathways, which may lead to the identification of novel targets for therapeutic applications targeting dysregulated cancer metabolism.

Keywords: BCAT; Breast cancer; HER2 +; IDH; Luminal A.


Conflict of interest statement

The authors declare that they have no conflict of interest statement.

Figures
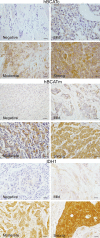
Fig. 1
Fig. 1
Representative images of the intensity of immune reaction for each of the metabolic proteins, as indicated, in human breast cancer sections. Slides were scored using the IRS scoring system and images captured by Leica microscope using a × 40 objective (scale bars = 25 μm)
Fig. 2
Fig. 2
Proportion of cells expressing hBCATc and intensity of reaction was significantly associated with HER2 subtype. a, b Bar chart showing the percentage of cases of hBCATc (a) proportion and (b) intensity of the immunoreactivity for each of the subtypes of breast cancer (c) bar chart of percentage of hBCATc staining intensity between ER receptor negative and positive tumours (d) bar chart of percentage of hBCATc staining intensity between HER2 receptor negative and positive tumours (e) summary of the p values for the chi-square linear-by-linear test of association for hBCATc proportion and intensity association to TNBC, luminal A, luminal B and HER2 subtypes and to ER and HER2 receptor status
Fig. 3
Fig. 3
Proportion of cells expressing hBCATm was significantly associated with Luminal A subtype and ER receptor status. a, b Bar chart showing the percentage of cases of hBCATm (a) proportion and (b) intensity of the immunoreactivity for each of the subtypes of breast cancer (c) bar chart of percentage of hBCATm staining intensity between ER receptor negative and positive tumours (d) bar chart of percentage of hBCATm staining intensity between HER2 receptor negative and positive tumours (e) summary of the p values for the chi-square linear-by-linear test of association for hBCATm proportion and intensity associated to TNBC, luminal A, luminal B and HER2 subtypes and to ER and HER2 receptor status
Fig. 4
Fig. 4
Proportion of cells expressing IDH1 intensity of reaction was significantly associated with Luminal A subtype. a, b Bar chart showing the percentage of cases of IDH1 (a) proportion and (b) intensity of the immunoreactivity for each of the subtypes of breast cancer (c) bar chart of percentage of IDH1 staining intensity between ER receptor negative and positive tumours (d) bar chart of percentage of IDH1 staining intensity between HER2 receptor negative and positive tumours (e) summary of the p values for the Chi-square linear-by-linear test of association for IDH1 proportion and intensity association to TNBC, luminal A, luminal B and HER2 subtypes and to ER and HER2 receptor status
Fig. 5
Fig. 5
Representative images of the hBCAT and IDH1 proteins in different molecular breast cancer subtypes. hBCATc levels were significantly elevated in the HER-2 subtype and Luminal B subtypes. Luminal A subtype was characterised with increased levels of hBCATm and IDH1. × 10 objective (scale bars = 25 μm)
Fig. 6
Fig. 6
hBCATm and IDH1 co-expression was found to be significantly significant. a Co-expression of hBCATm and IDH1 was observed in the same cells. b Table showing the linear by linear p-values for hBCATm proportion, intensity and IRS class association with IDH1 expression. × 10 objective (scale bars = 250 μm)
Fig. 7
Fig. 7
Disease-free survival for each of the metabolic proteins. Kaplan Meier analysis for a hBCATc b hBCATm c IDH1 low vs high total IRS class. Statistics were calculated from Log rank Mantel-Cox analysis

Similar articles

Cited by

References

    1. Bray F, Ferlay J, Soerjomataram I, et al. Global cancer statistics 2018: GLOBOCAN estimates of incidence and mortality worldwide for 36 cancers in 185 countries. CA Cancer J Clin. 2018;68:394–424. doi: 10.3322/caac.21492. - DOI - PubMed
    1. Kondov B, Milenkovikj Z, Kondov G, et al. Presentation of the molecular subtypes of breast cancer detected by immunohistochemistry in surgically treated patients. Open Access Maced J Med Sci. 2018;6:961. doi: 10.3889/oamjms.2018.231. - DOI - PMC - PubMed
    1. Perou CM, Sørile T, Eisen MB, et al. Molecular portraits of human breast tumours. Nature. 2000;406:747–752. doi: 10.1038/35021093. - DOI - PubMed
    1. Sørlie T, Tibshirani R, Parker J, et al. Repeated observation of breast tumor subtypes in independent gene expression data sets. Proc Natl Acad Sci USA. 2003;100:8418–8423. doi: 10.1073/pnas.0932692100. - DOI - PMC - PubMed
    1. Creighton CJ. The molecular profile of luminal B breast cancer. Biologics. 2012;6:289–297. doi: 10.2147/BTT.S29923. - DOI - PMC - PubMed