Review
. 2022 Jan;43(1):207-233.
doi: 10.1002/hbm.25326. Epub 2020 Dec 27.

FreeSurfer-based segmentation of hippocampal subfields: A review of methods and applications, with a novel quality control procedure for ENIGMA studies and other collaborative efforts

Affiliations
Review

FreeSurfer-based segmentation of hippocampal subfields: A review of methods and applications, with a novel quality control procedure for ENIGMA studies and other collaborative efforts

Philipp G Sämann et al. Hum Brain Mapp. 2022 Jan.

Abstract

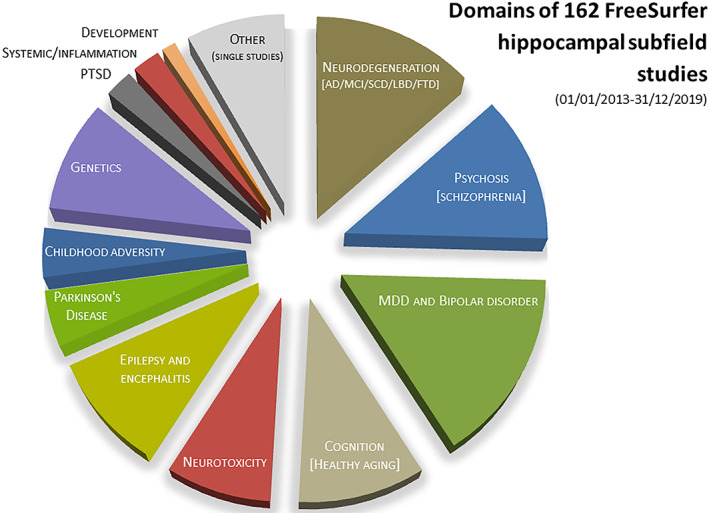
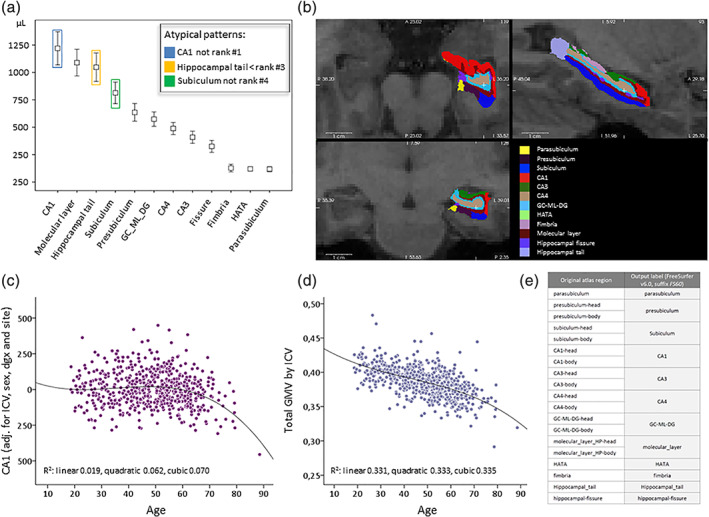
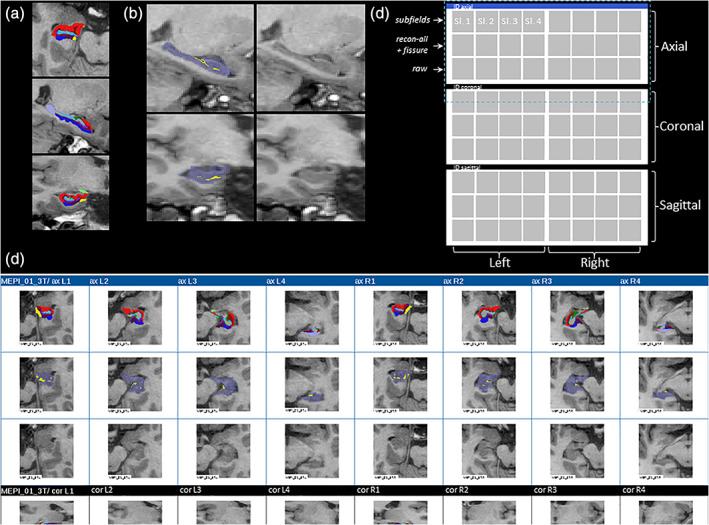
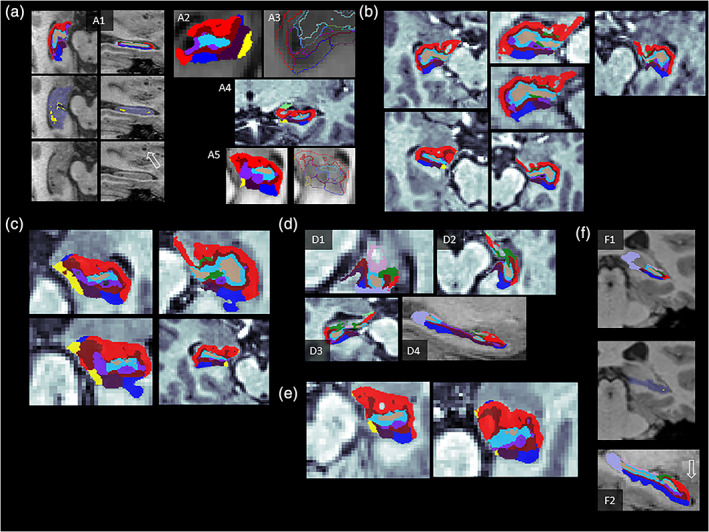
Structural hippocampal abnormalities are common in many neurological and psychiatric disorders, and variation in hippocampal measures is related to cognitive performance and other complex phenotypes such as stress sensitivity. Hippocampal subregions are increasingly studied, as automated algorithms have become available for mapping and volume quantification. In the context of the Enhancing Neuro Imaging Genetics through Meta Analysis Consortium, several Disease Working Groups are using the FreeSurfer software to analyze hippocampal subregion (subfield) volumes in patients with neurological and psychiatric conditions along with data from matched controls. In this overview, we explain the algorithm's principles, summarize measurement reliability studies, and demonstrate two additional aspects (subfield autocorrelation and volume/reliability correlation) with illustrative data. We then explain the rationale for a standardized hippocampal subfield segmentation quality control (QC) procedure for improved pipeline harmonization. To guide researchers to make optimal use of the algorithm, we discuss how global size and age effects can be modeled, how QC steps can be incorporated and how subfields may be aggregated into composite volumes. This discussion is based on a synopsis of 162 published neuroimaging studies (01/2013-12/2019) that applied the FreeSurfer hippocampal subfield segmentation in a broad range of domains including cognition and healthy aging, brain development and neurodegeneration, affective disorders, psychosis, stress regulation, neurotoxicity, epilepsy, inflammatory disease, childhood adversity and posttraumatic stress disorder, and candidate and whole genome (epi-)genetics. Finally, we highlight points where FreeSurfer-based hippocampal subfield studies may be optimized.

Keywords: ENIGMA; FreeSurfer; MRI; hippocampal subfields; hippocampal subregions; hippocampus; quality control; segmentation.


Conflict of interest statement

The authors declare no conflict of interest.

Figures

FIGURE 1
FIGURE 1
Domains covered by 162 FreeSurfer subfields studies published between 2013 and 2019. Ten studies performed on patient groups with a genetic analysis included (see Supplemental Table 1, domain/subdomain “genetics”) were counted double to avoid under‐representation of genetic studies, that is, the pie chart contains a total of 172 entries. The following additional aggregations were made: major depressive disorder (MDD) and bipolar disorder (21 and 6 studies) were pooled; single neurological (8), single psychiatric studies (5) and one study on perceived stress were pooled to a category “other (single studies)”; studies on epilepsy (10) and encephalitis (5) were pooled. AD, Alzheimer's disease; FTD, frontotemporal dementia; LBD, Lewy body disease; MCI, mild cognitive impairment; PTSD, posttraumatic stress disorders; SCD, subjective cognitive deficits
FIGURE 2
FIGURE 2
Typical subfield size ranking, overlay in FreeSurfer viewer and exemplary age‐volume relationships. (a) Typically raw subfield volumes ranked according to their average size are depicted from a local Max Planck Institute of Psychiatry (MPIP)‐based sample of N = 614 subjects (T1WI, FS6.0, mean values and 1 SD). The volume ranking order is extremely robust across other samples including 3 Tesla samples (data not shown). The colored frames point to subregions that underlie ranking violation rules (see Section 2.3 for details). (b) A 3 Tesla example viewed in FS in three corresponding planes (see white cross‐hair) with the FS inherent color scheme. The same scheme for the 12 subregions was adopted in the ENIGMA quality control (QC) algorithm. (c) An example of a tendency for nonlinear age effects for the bilateral CA1 region, adjusted for intracranial volume (ICV), sex, diagnosis (major depressive disorder [MDD]/healthy) and site (here coding for coil upgrade related raw image differences). Quadratic or cubic polynomial fits are superior to a linear correlation. (d) The same principle is plotted for the ratio between total gray matter volume and ICV; a less strong nonlinear influence can be read from the fit values. (e) One of three aggregation schemes available in recent development versions of FS, referred to as “FS60,” explaining the mapping between the 12 output labels (which are the labels in the FS6.0 atlas used in this study) and the underlying regions
FIGURE 4
FIGURE 4
Exemplary overlays of full segmentation results, combined hippocampal starting mask and fissure, and full visual quality control (QC) output. (a) 3 Tesla examples of (bias field corrected) T1‐weighted input image and exemplary axial and sagittal colored subfield segmentation. (b) Principle of combined background image, and hippocampal starting mask (from general subcortical segmentation [recon‐all]), and hippocampal fissure, allowing a check of basic orientation/rotation, successful basic hippocampal segmentation (purple transparent overlay) and correct placement of hippocampal fissure (yellow) within the hippocampal starting mask in one glance. (c) Layout structure of HTML output of one case. One 8 × 3 set of images usually fits on a large screen, so a maximum of one page flip is needed to finalize one case. Dark blue horizontal bars separate cases from each other. Dashed purple box marks the area for which a real example is depicted in (d). (d) Exemplary HTML‐output of one case (limited to axial and part of the coronal output images). Sl., slice number
FIGURE 3
FIGURE 3
Examples of normal anatomical variants, peculiarities and phenomena, and discrepancy between the binary hippocampal mask and segmentation results. Images are displayed at (unsmoothed) 1‐mm isometric resolution, and subfield overlays at 0.333‐mm isometric resolution. Anonymized examples are differently contrasted as they stem from several sites with different display settings. All shown examples would not necessarily need to be excluded, yet see specific comments on a2 and a5. (a1) Example of sulcus remnant cysts that are found in ~25% of adults between the dentate gyrus and the cornu ammonis; considered an incidental finding with no pathological implication; classified as hippocampal fissure (yellow on mid row image) which represents CSF intensity. Similar peri‐ or intrahippocampal cysts exist, such as choroidal fissure cysts (etiologically arachnoid or neuroglial or neuroepithelial cysts) may similarly be classified as hippocampal fissure, or extra‐hippocampal (“background”) by the algorithm, depending on location details. Certain types of cysts may co‐occur with enlarged perivascular spaces (Virchow Robin spaces), for example, in the lower basal ganglia or midbrain (see open arrows in a1). (a2) A cystic area not classified as fissure, but as extra‐hippocampal background, and a part of CA1 seems neglected. Depending on the amount of such truncated hippocampal tissue, extreme cases of this type should be excluded. (a3–a5) Examples of cysts either classified clearly as fissure, or as background (i.e., no hippocampal subregion). a5 likely classified the fissure correctly that, however, appears brighter than CSF on the raw image due to partial volume effects. More extreme cases (hippocampal fissure intensity being too bright on T1WI or not represented on T2WI) should be excluded, and the hippocampal fissure volume may contain cysts. (b) Very frequent (90%) yet practically negligible observed discontinuous appearance of CA1 and/or smaller spared regions (“holes”) within CA1. (c) Subfields extending into another subfield or forming small extensions/islands; though visually conspicuous the volume effect of such extensions is negligible. (d) “Holes” localizable to fimbria (light pink, d1), or CA3 (green) or CA1 (red) as in d2 or d3 are caused by the removal of the alveus (white matter layer on the superior rim of the hippocampus) area in the final binary classification step, which may cause the impression of an abrupt ending of the segmentation. (e) “Bulky” appearance of CA1 in the sense of this subfield strongly dominating the appearance on one slice. This may occur due to strict orthogonal slicing in native space. (f1) Example of standard hippocampal segmentation (recon‐all) missing parts of the posterior hippocampus, while the subfield segmentation v6.0 correctly detects these parts. Incompleteness of the standard binary hippocampal starting mask should therefore not be an exclusion criterion per se. (f2) Anterior parts seem truncated, yet lie in the amygdala complex; this appearance is normal and does not indicate a failed segmentation
FIGURE 5
FIGURE 5
Overall quality control (QC) flow scheme for a FreeSurfer‐based hippocampal subfield study. Depending on local pipelines, general QC steps regarding the raw data quality, motion artifacts and complete coverage may be performed directly on the picture archiving system and be study‐independent. A general inspection of the cortical/subcortical segmentation result of FS is recommended before subfield specific operations. Steps 2–7 are supported by a script package written in MATLAB, R, and Shell. “freeview + subfields” refers to an individual check using the interactive FS viewing tool (https://surfer.nmr.mgh.harvard.edu/fswiki/HippocampalSubfields)
FIGURE 6
FIGURE 6
Relationship between surface and volumetric subfield composition. (a) Surface subfields are defined by the volume subfield nearest to the surface. For each surface element, we integrate the 3D subfields between the surface and the medial curve. The pie chart represents the proportion of volume subfields underlying the surface line (red). The figure is drawn in 2D for illustration purposes only, yet, the principle can be equally applied to a 2D patch at the surface. (b) An individual hippocampal model with surface subfields and a coronal slice of the volumetric subfields from FS6.0. The dark purple line is the medial curve

References

    1. Aanes, S. , Bjuland, K. J. , Sripada, K. , Sølsnes, A. E. , Grunewaldt, K. H. , Håberg, A. , … Skranes, J. (2019). Reduced hippocampal subfield volumes and memory function in school‐aged children born preterm with very low birthweight (VLBW). NeuroImage: Clinical, 23, 101857. - PMC - PubMed
    1. Aas, M. , Haukvik, U. K. , Djurovic, S. , Tesli, M. , Athanasiu, L. , Bjella, T. , … Melle, I. (2014). Interplay between childhood trauma and BDNF val66met variants on blood BDNF mRNA levels and on hippocampus subfields volumes in schizophrenia spectrum and bipolar disorders. Journal of Psychiatric Research, 59, 14–21. - PubMed
    1. Ahmed‐Leitao, F. , Rosenstein, D. , Marx, M. , Young, S. , Korte, K. , & Seedat, S. (2019). Posttraumatic stress disorder, social anxiety disorder and childhood trauma: Differences in hippocampal subfield volume. Psychiatry Research: Neuroimaging, 284, 45–52. - PubMed
    1. Al‐Amin, M. , Bradford, D. , Sullivan, R. K. P. , Kurniawan, N. D. , Moon, Y. , Han, S.‐H. , … Burne, T. H. J. (2019). Vitamin D deficiency is associated with reduced hippocampal volume and disrupted structural connectivity in patients with mild cognitive impairment. Human Brain Mapping, 40, 394–406. - PMC - PubMed
    1. Al‐Amin, M. , Zinchenko, A. , & Geyer, T. (2018). Hippocampal subfield volume changes in subtypes of attention deficit hyperactivity disorder. Brain Research, 1685, 1–8. - PubMed

Publication types

MeSH terms