. 2021 Mar;42(4):841-870.
doi: 10.1002/hbm.25189. Epub 2020 Dec 24.

Subject-specific segregation of functional territories based on deep phenotyping

Affiliations

Subject-specific segregation of functional territories based on deep phenotyping

Ana Luísa Pinho et al. Hum Brain Mapp. 2021 Mar.

Abstract

Functional magnetic resonance imaging (fMRI) has opened the possibility to investigate how brain activity is modulated by behavior. Most studies so far are bound to one single task, in which functional responses to a handful of contrasts are analyzed and reported as a group average brain map. Contrariwise, recent data-collection efforts have started to target a systematic spatial representation of multiple mental functions. In this paper, we leverage the Individual Brain Charting (IBC) dataset-a high-resolution task-fMRI dataset acquired in a fixed environment-in order to study the feasibility of individual mapping. First, we verify that the IBC brain maps reproduce those obtained from previous, large-scale datasets using the same tasks. Second, we confirm that the elementary spatial components, inferred across all tasks, are consistently mapped within and, to a lesser extent, across participants. Third, we demonstrate the relevance of the topographic information of the individual contrast maps, showing that contrasts from one task can be predicted by contrasts from other tasks. At last, we showcase the benefit of contrast accumulation for the fine functional characterization of brain regions within a prespecified network. To this end, we analyze the cognitive profile of functional territories pertaining to the language network and prove that these profiles generalize across participants.

Keywords: atlases; brain imaging; cognitive function; data set; functional magnetic resonance imaging.


Figures

FIGURE 1
FIGURE 1
Reproduction of previous large‐cohort neuroimaging results. The matrix displays the correlation between group‐average z‐maps of the main contrasts from different datasets, thus providing a quantitative assessment of the similarity between ARCHI and Individual Brain Charting (IBC) results as well as HCP and IBC results. With one exception, that is, punishment‐reward of the HCP gambling task, the dominant diagonal terms hint at good reproduction
FIGURE 2
FIGURE 2
Activation maps of the contrasts estimated from the conditions in the HCP Working Memory task. Individual maps for fixed effects are displayed for every participant, using an FDR‐corrected threshold q = 0.05. The group‐level conjunction map of these individual maps is shown inside the orange frame. All maps correspond to the slice x = 40 mm in the sagittal view
FIGURE 3
FIGURE 3
Comparison of intrasubject and intersubject variability across contrasts. The bar chart represents the means of the distributions of the correlations of z‐maps per contrast within and between subjects. Bars in salmon correspond to correlations of z‐maps per contrast, for all subject pairs; bars in gray correspond to correlations estimated from all possible pairs of “PA” and “AP” runs (see Section 2.5 for details). Error bars represent the 95% CI
FIGURE 4
FIGURE 4
Dictionary of 20 cognitive components summarizing 13 individual topographies in fsaverage space. (Top left/right) Labeling of left/right hemispheric cortical regions, according to the strongest dictionary loading in that region. The top‐right brain maps outlined in red of each image display a median map obtained at group level, that is, a label is assigned to a component if, at least, half of the participants have that label at that location. (Middle) The 20 cognitive components are labeled according to the contrast z‐map that gets the maximum loading for that component. (Bottom) The boxplots represent the distribution of the intrasubject and intersubject stability of the components and whiskers show the 95% CI. Both intrasubject and intersubject data were split into two halves of the dataset, according to the phase‐encoding direction parameter of acquisition. Dictionaries were estimated separately for each dataset. Split‐half reproducibility of the spatial loadings was obtained, as their correlation, within and between subjects. While intrasubject correlations are relatively high, intersubject ones are low, thus hinting again at a strong subject effect. Black horizontal lines, going through the boxes, represent the median in both distributions. Overall, this figure illustrates the consistency of some components, while it outlines local and large‐scale differences across the Individual Brain Charting (IBC) participants
FIGURE 5
FIGURE 5
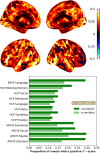
Within‐subject accuracy prediction of contrast maps. (Top) Accuracy prediction (maximum R2score) obtained from a leave‐three‐subjects‐out cross‐validation experiment across tasks, in which contrast maps from a target task were predicted from the contrasts of the training tasks. These results quantify the amount of functional activity at every voxel that can be predicted, conditional on other contrasts. Most regions of the brain are covered by the predicted functional signatures, with a few exceptions: hippocampus, superior temporal asymmetrical pit, precuneus and inferior temporal gyrus. (Bottom) Proportion of voxels with a positive R2score per task indicates the size of brain regions functionally characterized by each task. Permutations of the subjects in the same analysis decrease this proportion in all tasks, showing that the captured topographies are subject‐specific. Chance level is 0.00 in all tasks, for both “consistent” and “scrambled” schemes
FIGURE 6
FIGURE 6
Comparison of the cognitive profile for a set of regions‐of‐interest belonging to the language network. This figure illustrates how cognitive profiles of functional regions can be derived from their quantitative contribution in a set of independent contrasts pertaining to language mechanisms. The direct comparison of such contributions highlights the dissociation of the role of these regions in lower‐order and higher‐order semantic processing, given respectively their contribution either in the contrasts “read words versus read pseudo words,” “read words versus read consonant strings” plus “read pseudo words versus consonant strings” or in the contrasts “read sentence versus read words,” “read sentence versus read jabberwocky” plus “sentence versus mental subtraction.” Each bar plot represents, for a set of contrast z‐maps, the means of the distributions across subjects of the average of z‐scores in a set of voxels inside a regions‐of‐interest. Error bars represent the 95% CI. Bar colors identify each of the six regions‐of‐interest, placed in the left hemisphere, that are in evidence on the glass brain: (red) Inferior frontal gyrus (IFG) pars orbitalis, (yellow) IFG pars triangularis, (cyan) temporoparietal junction, (green) temporal pole, (dark blue) anterior superior temporal sulcus (STS), and (purple) posterior STS
FIGURE 7
FIGURE 7
Accuracy obtained for the classification of voxels into pairs of regions‐of‐interest, against chance level. The scores were estimated based on the functional activation of voxels from different pairs of regions‐of‐interest pertaining to the language network. Combinations of two brain regions from a total amount of six regions from the left hemisphere—inferior frontal gyrus (IFG) pars orbitalis, IFG pars triangularis, temporal pole, temporoparietal junction, anterior superior temporal sulcus (STS), and posterior STS—were employed in a leave‐one‐subject‐out cross‐validation experiment to calculate classification accuracy. The functional profiles of the voxels were extracted from contrasts of the Individual Brain Charting (IBC) dataset that relate to language mechanisms (see Figure 6)
FIGURE A1
FIGURE A1
Comparison of intersubject and intrasubject variability across contrasts between IBC and HCP datasets. The bar chart represents the means of the distributions referring to the correlations of z‐maps per contrast. (Left panel) Intersubject correlations were estimated from pairs of contrasts for all subjects pairs, whereas (Right panel) intrasubject correlations were estimated from all possible pairs of contrasts from “PA” and “AP” runs, within sessions. Bars in orange correspond to the correlations of contrasts obtained from the IBC dataset; bars in blue correspond to the correlations of contrasts obtained from the HCP dataset. Error bars represent the 95% CI
FIGURE A2
FIGURE A2
Comparison of intersubject variability across contrasts between IBC and ARCHI datasets. The bar chart represents the means of the distributions referring to the correlations of z‐maps per contrast, for all subjects pairs. Bars in orange correspond to the correlations of contrasts obtained from the IBC dataset; bars in blue correspond to the correlations of contrasts obtained from the ARCHI dataset. Error bars represent the 95% CI
FIGURE A3
FIGURE A3
Subject‐specific regions‐of‐interest on evidence in a glass brain. This panel provides glass brain maps, on the left sagittal plane, of six regions‐of‐interest of the language network, as described in Pallier et al. (2011), projected onto individual templates obtained after dual regression, for every participant featuring the IBC dataset first‐release. Each region‐of‐interest is marked in a different color on the glass brain: (red) left inferior frontal gyrus (IFG) pars orbitalis, (yellow) left IFG pars triangularis, (cyan) left temporoparietal junction, (green) left temporal pole, (dark blue) left anterior superior temporal sulcus (STS), and (purple) left posterior STS
FIGURE A4
FIGURE A4
Prediction scores of voxel classification as belonging to one out of two regions‐of‐interest against chance level. The scores were estimated based on the functional activation of voxels from different pairs of regions‐of‐interest pertaining to the language network. Combinations of two brain regions from a total amount of six regions—inferior frontal gyrus (IFG) pars orbitalis, IFG pars triangularis, temporal pole, temporoparietal junction, anterior superior temporal sulcus (STS) and posterior STS—were employed in a cross‐validation experiment to calculate each prediction score. The functional profiles of the voxels were extracted from all main contrasts of all tasks of the IBC‐dataset first release
FIGURE A5
FIGURE A5
Comparison of the cognitive profiles for a set of regions‐of‐interest delineated from the contrast story versus math of the HCP Language task. To verify that results are not strictly tied to particular choices concerning the selection of regions‐of‐interest, the same analysis—as described in Section 2.7.8—was conducted in a different set of regions‐of‐interest extracted from the group‐level contrast story versus math of the HCP Language task, which was estimated from data referring to 786 participants of the HCP900 dataset. Not only both sets overlap to a considerable extent but also they share consistent results between them (see Figure 6 for a direct comparison with the present one). Each bar plot represents, for a set of contrast z‐maps, the means of the distributions across subjects of the average of z‐scores in a set of voxels inside a regions‐of‐interest. Error bars represent the 95% CI. Bar colors identify four regions‐of‐interest that are in evidence on the glass brain: (magenta) Ventromedial Prefrontal Cortex, (orange) left Inferior Frontal Gyrus, (light blue) left anterior Superior Temporal Sulcus plus left Temporal Pole, and (cyan) left Temporoparietal Junction
FIGURE A6
FIGURE A6
Prediction scores of voxel classification as belonging to one out of two regions‐of‐interest against chance level for the regions‐of‐interest delineated from the contrast story versus math of the HCP Language task. The scores were estimated based on the functional activation of voxels from different pairs of regions‐of‐interest pertaining to the language network. Combinations of two brain regions from a total amount of four regions—ventromedial prefrontal cortex (ventromedial PFC), left inferior frontal gyrus (IFG), left anterior superior temporal sulcus (STS) plus left Temporal Pole, and left Temporoparietal Junction—were employed in a cross‐validation experiment to calculate each prediction score. The functional profiles of the voxels were extracted from: (left) the contrasts of the IBC dataset that relate to semantic processing in language (see Figure A5); and (right) all main contrasts of all tasks of the IBC‐dataset first release

References

    1. Abraham, A. , Dohmatob, E. , Thirion, B. , Samaras, D. , & Varoquaux, G. (2013). Extracting brain regions from rest fMRI with total‐variation constrained dictionary learning. In MICCAI—16th International Conference on Medical Image Computing and Computer Assisted Intervention ‐ 2013 Nagoya, Japan: Springer. 10.1007/978-3-642-40763-5.75 - DOI - PubMed
    1. Abraham, A. , Pedregosa, F. , Eickenberg, M. , Gervais, P. , Mueller, A. , Kossaifi, J. , … Varoquaux, G. (2014). Machine learning for neuroimaging with scikit‐learn. Frontiers in Neuroinformatics, 8, 14 10.3389/fninf.2014.00014 - DOI - PMC - PubMed
    1. Amalric, M. , & Dehaene, S. (2016). Origins of the brain networks for advanced mathematics in expert mathematicians. Proc Natl Acad Sci U S A, 113(18), 4909–4917. 10.1073/pnas.1603205113 - DOI - PMC - PubMed
    1. Andersson, J. L. , Skare, S. , & Ashburner, J. (2003). How to correct susceptibility distortions in spin‐echo echo‐planar images: Application to diffusion tensor imaging. NeuroImage, 20(2), 870–888. 10.1016/S1053-8119(03)00336-7 - DOI - PubMed
    1. Andin, J. , Fransson, P. , Rönnberg, J. , & Rudner, M. (2015). Phonology and arithmetic in the language–calculation network. Brain and Language, 143, 97–105. 10.1016/j.bandl.2015.02.004 - DOI - PubMed

Publication types