. 2020 Dec 14:(166):10.3791/61765.
doi: 10.3791/61765.

Obtaining Quality Extended Field-of-View Ultrasound Images of Skeletal Muscle to Measure Muscle Fascicle Length

Affiliations

Obtaining Quality Extended Field-of-View Ultrasound Images of Skeletal Muscle to Measure Muscle Fascicle Length

Amy N Adkins et al. J Vis Exp. .

Abstract

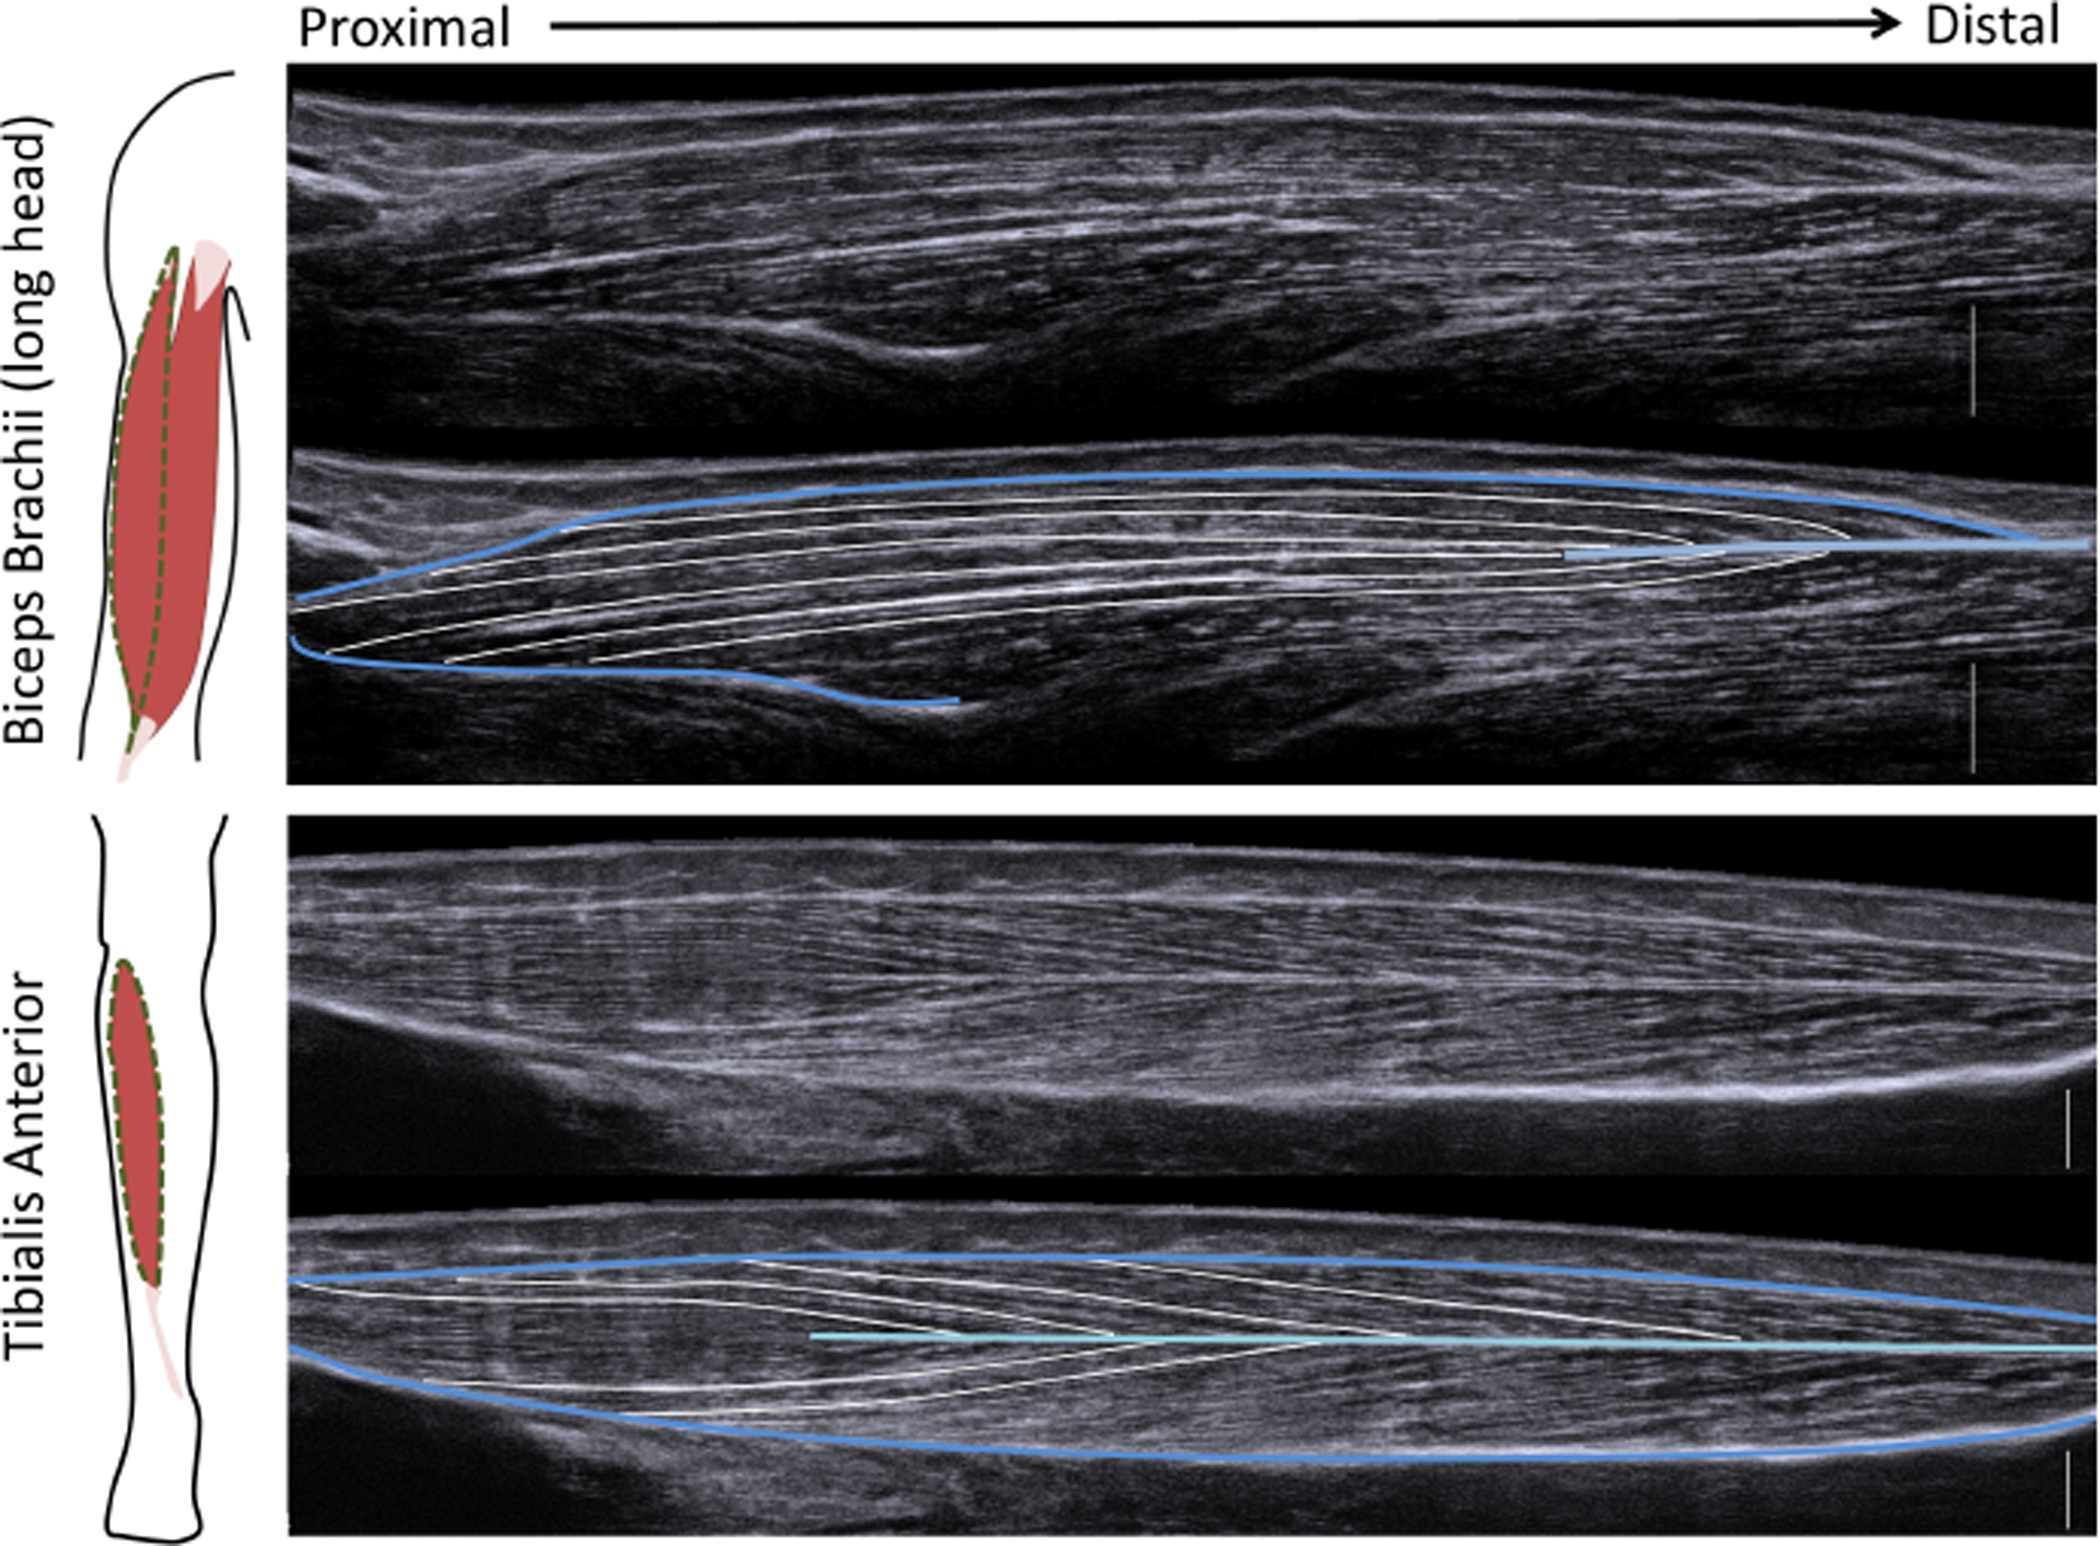
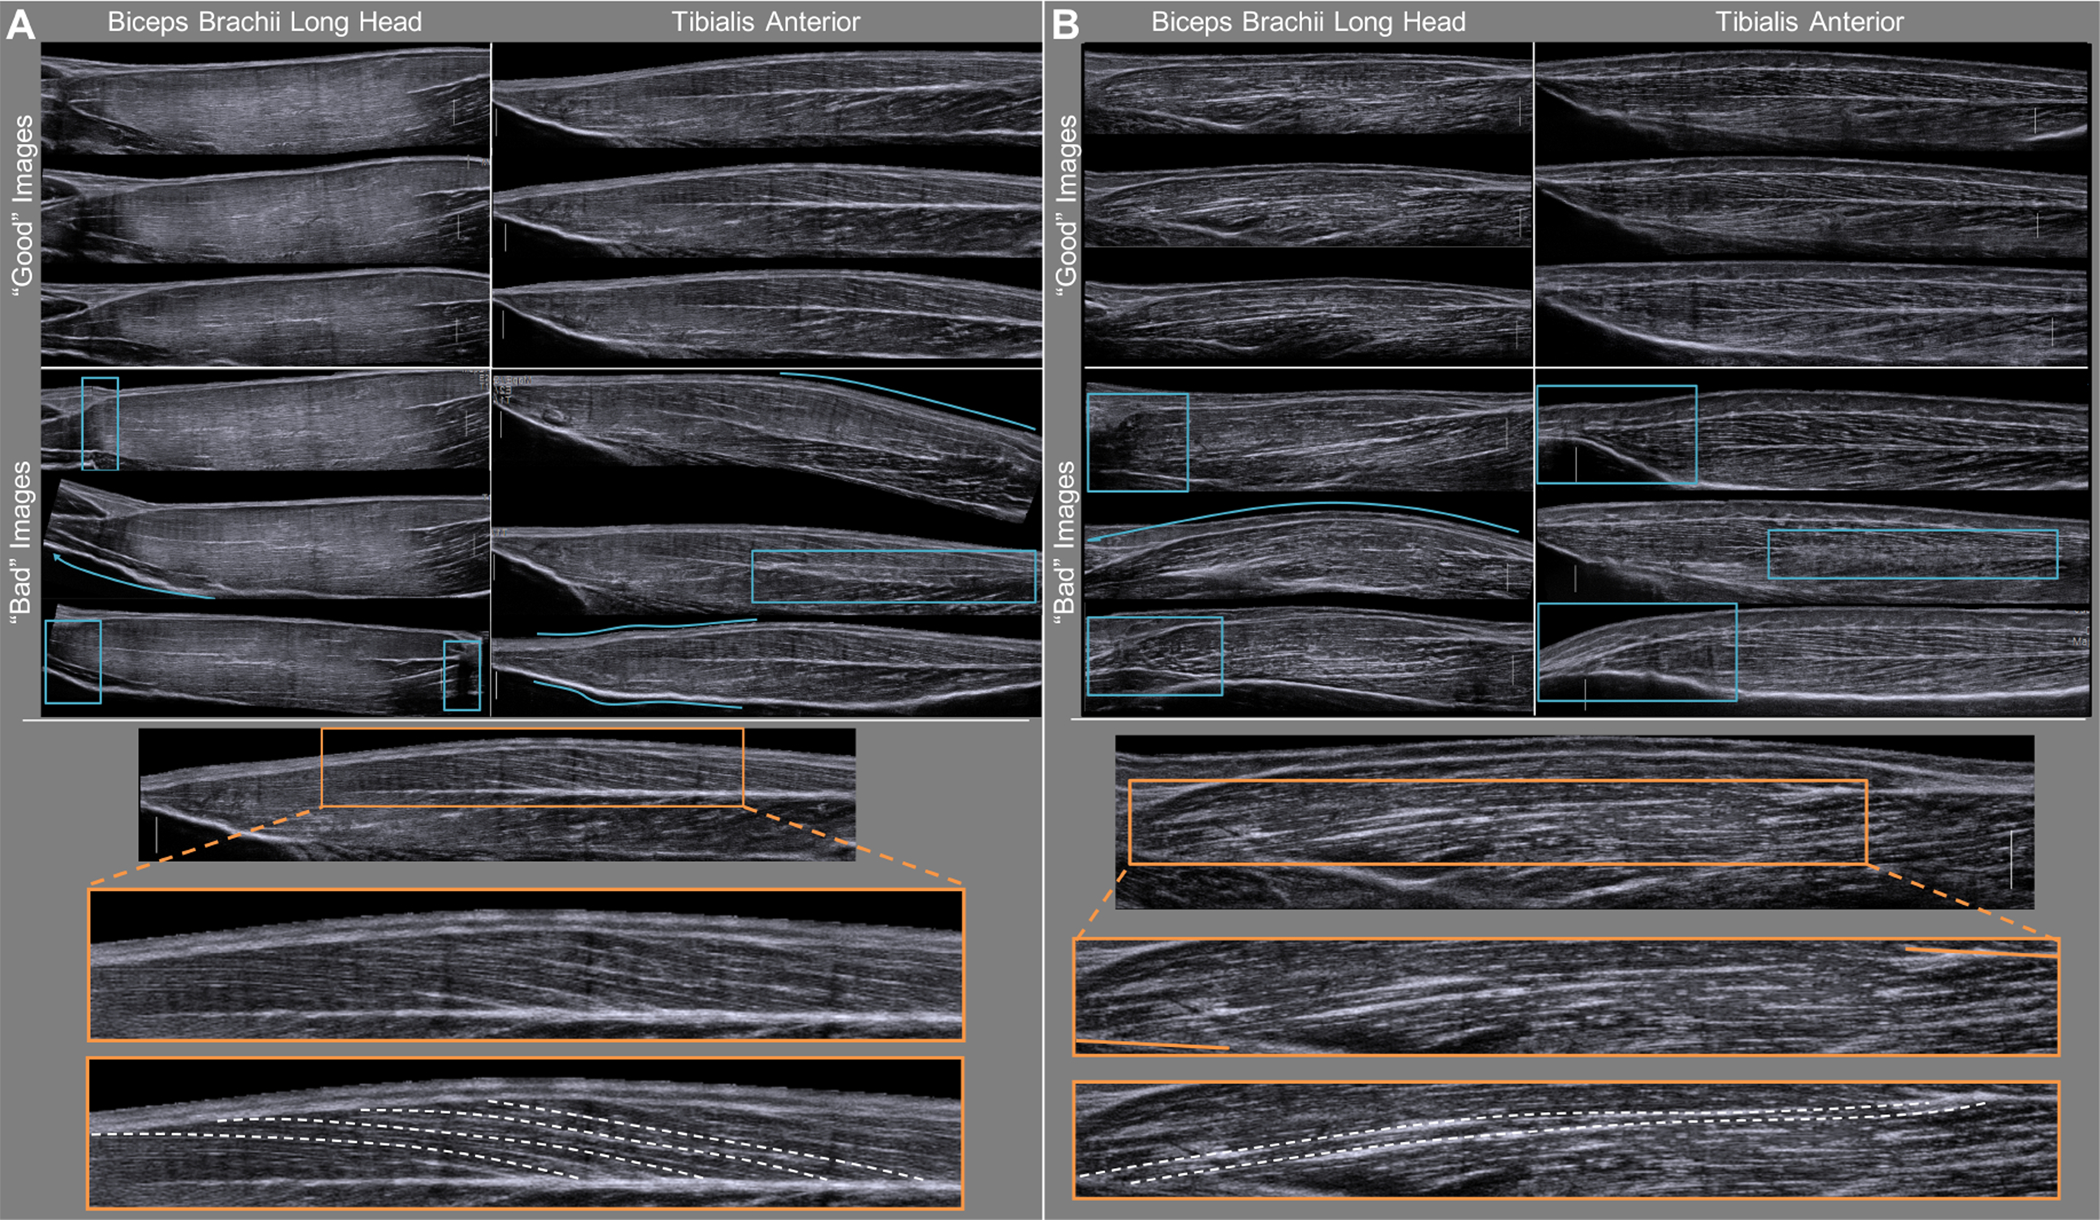
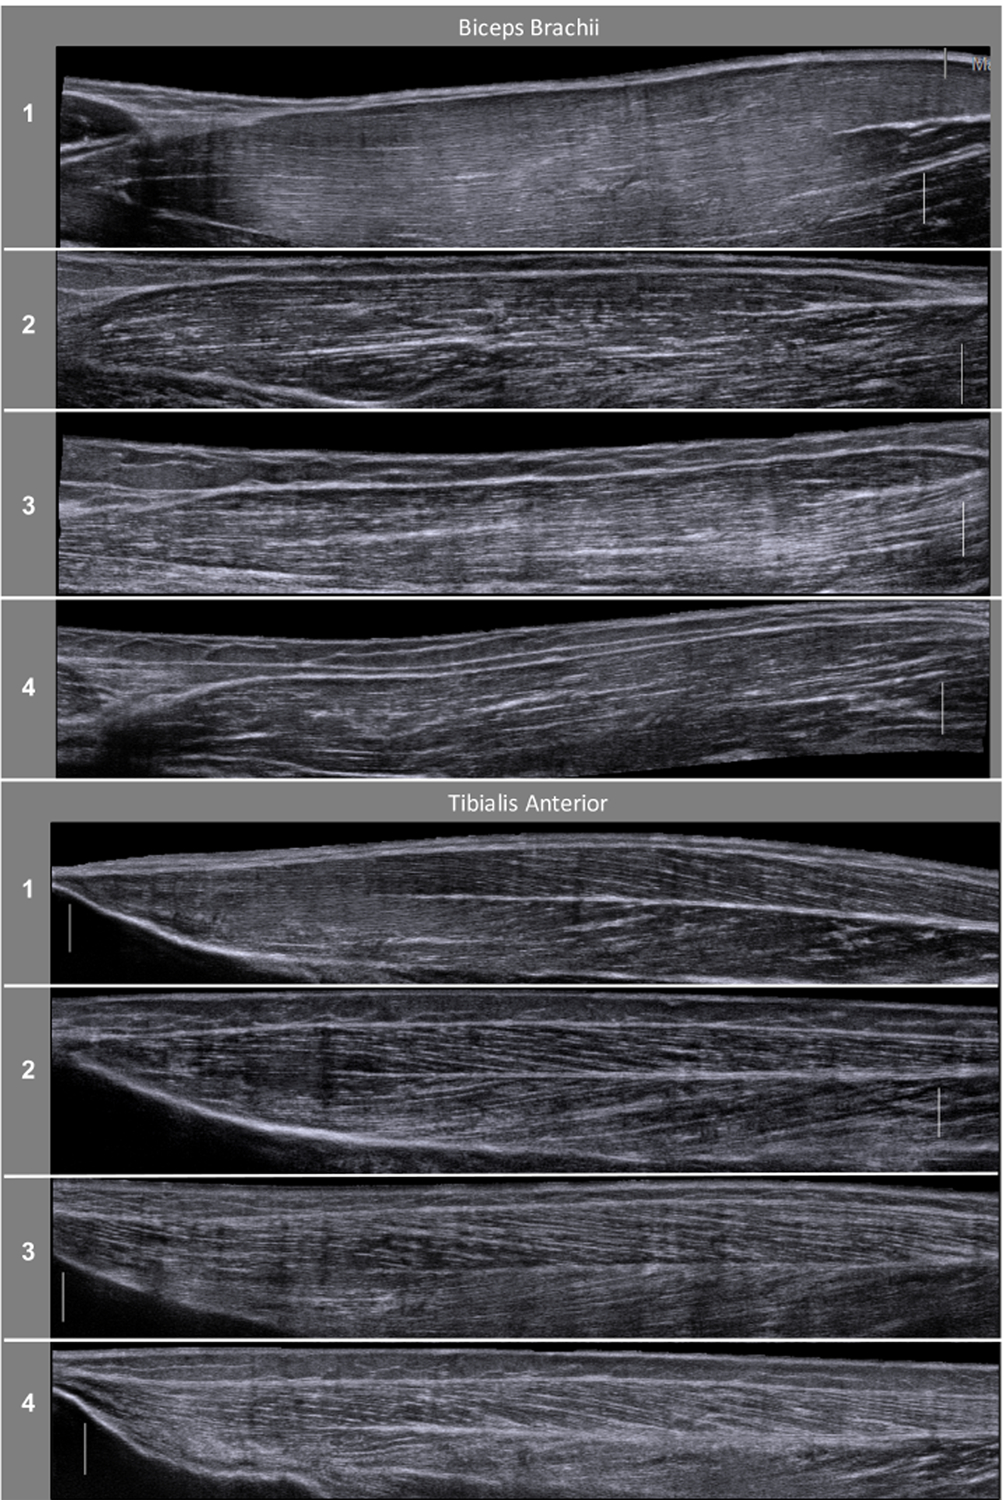
Muscle fascicle length, which is commonly measured in vivo using traditional ultrasound, is an important parameter defining a muscle's force generating capacity. However, over 90% of all upper limb muscles and 85% of all lower limb muscles have optimal fascicle lengths longer than the field-of-view of common traditional ultrasound (T-US) probes. A newer, less frequently adopted method called extended field-of-view ultrasound (EFOV-US) can enable direct measurement of fascicles longer than the field-of-view of a single T-US image. This method, which automatically fits together a sequence of T-US images from a dynamic scan, has been demonstrated to be valid and reliable for obtaining muscle fascicle lengths in vivo. Despite the numerous skeletal muscles with long fascicles and the validity of the EFOV-US method for making measurements of such fascicles, few published studies have utilized this method. In this study, we demonstrate both how to implement the EFOV-US method to obtain high quality musculoskeletal images and how to quantify fascicle lengths from those images. We expect that this demonstration will encourage the use of the EFOV-US method to increase the pool of muscles, both in healthy and impaired populations, for which we have in vivo muscle fascicle length data.


Figures

Figure 1:
Figure 1:. Schematic and EFOV images of two example muscles.
(left) Illustration of the muscle being studied. (right) Example of “good” images on top and the same image with whole muscle (dark blue), central tendon (light blue), and muscle fascicles (white) outlined. Each image has a corresponding 1 cm scale bar (white) on the bottom right of the image.
Figure 2:
Figure 2:. Demonstration of Image Quality.
Demonstration of three qualitatively “good” and three qualitatively “bad” images obtained from the biceps brachii and the tibialis anterior of participants 1 and 2. (Top A & B) In all the qualitatively “good” images fascicles which extend from internal tendon to muscle aponeurosis can be visualized. We illustrate images which are qualitatively “bad” and should not be analyzed. Portions of the image which qualify it is as “bad” are emphasized (blue boxes and arrows) and include jagged or broken images, excessive or non-anatomically relevant bending, images which exclude the entire fascicle, and images with blurred central tendons. Each image has a scale bar (white vertical line) which represents 1 cm. This portion of the figure is highlighting the variability among images due mainly to the sonographer’s inconsistency across separate imaging sweeps. (Bottom A & B) One “good” biceps and one “good” tibialis anterior muscle are shown. The orange box on the original image is then blown up to illustrate more accurately the zoom that is seen when measuring fascicles in ImageJ. The bottom image shows representative outlined fascicles (white dashed lines). These images are deemed “good” because fascicles can be followed from origin to insertion and the zoomed portion of the image doesn’t have substantial distortions or artifacts.
Figure 3:
Figure 3:. Variability in image quality across individuals.
Variability in image quality and visibility exists between participants, largely due to anatomical variation (i.e. muscle size, muscle length, subcutaneous fat content) and differences in muscle content (i.e. amounts of intramuscular fat, connective tissue, fibrosis). Specifically, variations in muscle content and layers of tissue above the muscle can affect the echo intensity of the imaged muscle. Natural anatomical differences across individuals will result in muscle architectural features varying in location and/or relative size across US images of different individuals. This demonstration of muscles in different participants stresses the importance of a thorough understanding of anatomy and sufficient practice obtaining images on various individuals for gaining confidence in the quality and accuracy of the images being obtained.

Similar articles

Cited by

References

    1. Gans C & Bock WJ The functional significance of muscle architecture: a theoretical analysis. Adv Anat Embryol Cell Biol. 38 115–142, (1965). - PubMed
    1. Gans C Fiber architecture and muscle function. Exercise and Sports Sciences Reviews. 10 160–207, (1982). - PubMed
    1. Lieber RL & Fridén J Functional and clinical significance of skeletal muscle architecture. Muscle & Nerve: Official Journal of the American Association of Electrodiagnostic Medicine. 23 (11), 1647–1666, (2000). - PubMed
    1. Zajac FE Muscle and tendon: properties, models, scaling, and application to biomechanics and motor control. Critical reviews in biomedical engineering. 17 (4), 359–411, (1989). - PubMed
    1. Williams PE & Goldspink G The effect of immobilization on the longitudinal growth of striated muscle fibres. Journal of Anatomy. 116 (Pt 1), 45, (1973). - PMC - PubMed

Publication types

MeSH terms

LinkOut - more resources