. 2021 Mar;599(5):1533-1550.
doi: 10.1113/JP280771. Epub 2021 Jan 13.

Post-exercise intramuscular O2 supply is tightly coupled with a higher proximal-to-distal ATP synthesis rate in human tibialis anterior

Affiliations

Post-exercise intramuscular O2 supply is tightly coupled with a higher proximal-to-distal ATP synthesis rate in human tibialis anterior

Linda Heskamp et al. J Physiol. 2021 Mar.

Abstract

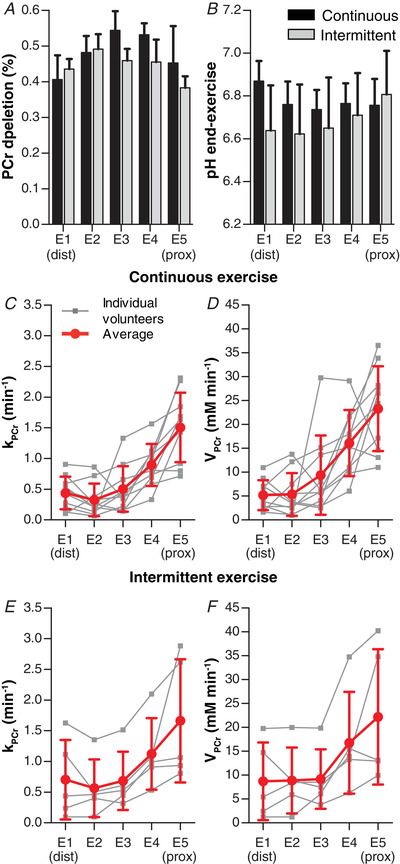
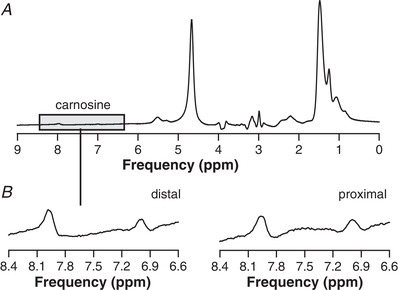
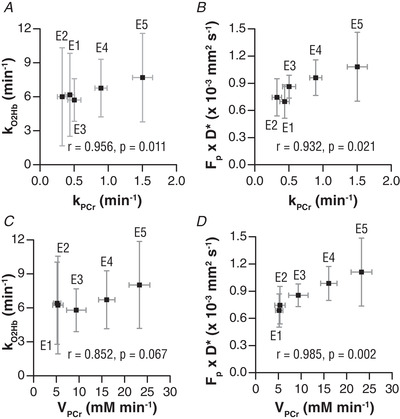
Key points: The post-exercise recovery of phosphocreatine, a measure of the oxidative capacity of muscles, as assessed by 31 P MR spectroscopy, shows a striking increase from distal to proximal along the human tibialis anterior muscle. To investigate why this muscle exhibits a greater oxidative capacity proximally, we tested whether the spatial variation in phosphocreatine recovery rate is related to oxygen supply, muscle fibre type or type of exercise. We revealed that oxygen supply also increases from distal to proximal along the tibialis anterior, and that it strongly correlated with phosphocreatine recovery. Carnosine level, a surrogate measure for muscle fibre type was not different between proximal and distal, and type of exercise did not affect the gradient in phosphocreatine recovery rate. Taken together, the findings of this study suggest that the post-exercise spatial gradients in oxygen supply and phosphocreatine recovery are driven by a higher intrinsic mitochondrial oxidative capacity proximally.

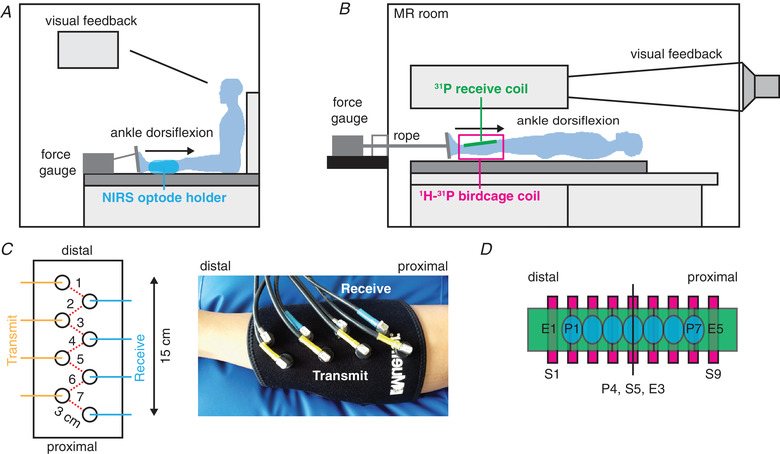
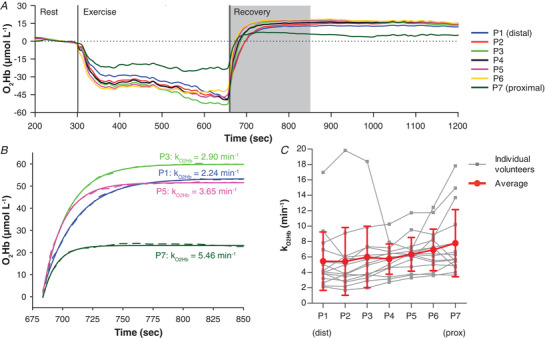
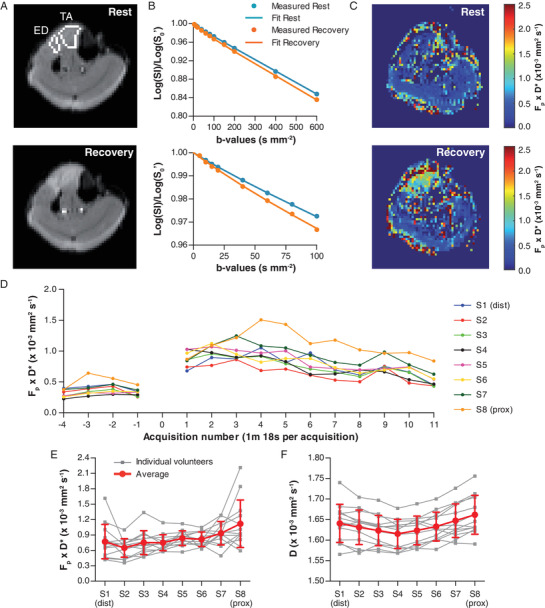
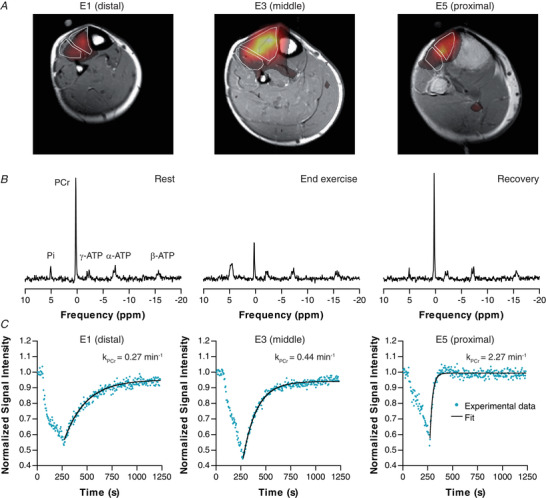
Abstract: Phosphorus magnetic resonance spectroscopy (31 P MRS) of human tibialis anterior (TA) revealed a strong proximo-distal gradient in the post-exercise phosphocreatine (PCr) recovery rate constant (kPCr ), a measure of muscle oxidative capacity. The aim of this study was to investigate whether this kPCr gradient is related to O2 supply, resting phosphorylation potential, muscle fibre type, or type of exercise. Fifteen male volunteers performed continuous isometric ankle dorsiflexion at 30% maximum force until exhaustion. At multiple locations along the TA, we measured the oxidative PCr resynthesis rate (VPCr = kPCr × PCr depletion) by 31 P MRS, the oxyhaemoglobin recovery rate constant (kO2Hb ) by near infrared spectroscopy, and muscle perfusion with MR intravoxel incoherent motion imaging. The kO2Hb , kPCr , VPCr and muscle perfusion depended on measurement location (P < 0.001, P < 0.001, P = 0.032 and P = 0.003, respectively), all being greater proximally. The kO2Hb and muscle perfusion correlated with kPCr (r = 0.956 and r = 0.852, respectively) and VPCr (r = 0.932 and r = 0.985, respectively), the latter reflecting metabolic O2 consumption. Resting phosphorylation potential (PCr/inorganic phosphate) was also higher proximally (P < 0.001). The surrogate for fibre type, carnosine content measured by 1 H MRS, did not differ between distal and proximal TA (P = 0.884). Performing intermittent exercise to avoid exercise ischaemia, still led to larger kPCr proximally than distally (P = 0.013). In conclusion, the spatial kPCr gradient is strongly associated with the spatial variation in O2 supply. It cannot be explained by exercise-induced ischaemia nor by fibre type. Our findings suggest it is driven by a higher proximal intrinsic mitochondrial oxidative capacity, apparently to support contractile performance of the TA.

Keywords: 31P magnetic resonance spectroscopy; magnetic resonance imaging; oxidative metabolism; phosphocreatine recovery; skeletal muscle.


Figures

Figure 1
Figure 1. Schematic overview of the experimental approach
A, set‐up for the NIRS measurement. The subject's foot was placed in a shoe attached to a pedal connected to a force gauge. The place of the NIRS optode holder is indicated in blue. B, set‐up for the MRI measurements. The subject's foot was placed in a shoe attached to a pedal and connected with a rope to a force gauge outside the scanner room. The subject received visual feedback by a projecter placed in the control room. C, overview of the placement of the four transmit and four receive optodes (all 3 cm apart) for the NIRS measurement, allowing oxyhaemoglobin assessment at seven positions along the muscle. D, schematic overview of the positioning of the seven NIRS measurement locations (blue, P1 to P7), the nine diffusion‐weighted slices (pink, S1 to S9) and the five 31P coil elements (green, E1 to E5). The middle positions (P4, S5, and E3) were centred at one third the distance between the fibula head and lateral malleolus, near the muscle belly. The 20 cm long 31P array coil covers the voluminous part of the tibialis anterior.
Figure 2
Figure 2. Time and spatial variations in the change in tissue oxyhaemoglobin (O2Hb) concentration assessed with near infrared spectroscopy (NIRS) in exercise experiments
A, typical example of one volunteer for the change in tissue O2Hb concentration during rest, exercise and recovery. Data are shown from the last 100 s of rest to 1200 s after the start of the experiment. An expansion of the time window during recovery, indicated by the grey block, is in B. B, recovery of O2Hb, baseline‐corrected to end‐exercise values, during the first 170 s after exercise for optode position P1 (distal), P3, P5, and P7 (proximal) depicted as dashed lines. The corresponding mono‐exponential fit is depicted as solid lines. C, recovery rate constant of O2Hb (k O2Hb) for each volunteer per optode position and averaged over all volunteers (P1 distal, P7 proximal). The linear gradient in k O2Hb was 0.15 min−1cm−1 (standard error: 0.04 min−1cm−1) Data are presented as means ± SD.
Figure 3
Figure 3. Results of IVIM acquisition of the lower leg for a typical example and average results in all volunteers
A, diffusion‐weighted images at rest (top) and recovery (bottom, acquisition 6) of the middle slice (S5) for b = 5 s mm−2 with the tibialis anterior (TA) and extensor digitorum (ED) delineated. The TA and ED show an increased signal intensity after exercise. B, example fit of the IVIM model on data from the TA during rest (blue) and recovery (orange) for b0 to b600 (top) and b0 to b100 (bottom). C, blood flow‐related parameter F p × D * map during rest (top) and recovery (bottom, acquisition 6) indicating an increased blood flow in TA and ED after exercise. D, F p × D * over time for the eight analysed slices. Acquisition 0 is the first acquisition after exercise and excluded from the analysis because it is prone to movement artefacts. E and F, average F p × D * and diffusion coefficient (D) over all volunteers depicted as the average over the whole recovery period after exercise (15 min 36 s) for the eight slices (S1 distal, S8 proximal). Data are presented as means ± SD.
Figure 4
Figure 4. Example of 31P imaging, 31P spectra and PCr signal intensity time‐course
A, overlay of 31P maps on T1 weighted 1H images, indicating that the majority of the 31P signal comes from the tibialis anterior. 31P intensity variations between slices may occur because of the 31P slice profile. B, 31P spectra showing inorganic phosphate (Pi), phosphocreatine (PCr) and the three resonances of ATP, and their change from rest to end‐exercise to end‐recovery. C, PCr signal time‐course for coil elements E1 (distal), E3 and E5 (proximal), showing a faster PCr recovery proximally. The PCr recovery rate k PCr assessed from spectra of each coil element is indicated.
Figure 5
Figure 5. 31P MRS results of the continuous isometric exercise and the intermittent isometric exercise for the coil elements E1 (distal) to E5 (proximal)
A, PCr depletion for both exercise regimes. B, pH at end‐exercise (pHendex) for both exercise regimes. C, phosphocreatine recovery rate (k PCr) during continuous isometric exercise. D, estimated PCr resynthesis rate (V PCr = k PCr × ΔPCr) during continuous isometric exercise. E, k PCr during intermittent isometric exercise. F, V PCr during intermittent isometric exercise. Data are presented as means ± SD.
Figure 6
Figure 6. Example 1H MR spectra from tibialis anterior
A, carnosine is represented by two peaks, at 7 and 8 ppm. Expansions of this spectral region from spectra of voxels positioned distally (B, left) and proximally (B, right).
Figure 7
Figure 7. Phosphocreatine (PCr) recovery rate constant (k PCr) and PCr resynthesis rate (V PCr) displayed against the oxyhaemoglobin recovery rate constant (k O2Hb) and IVIM measured blood flow (F p × D *)
A, kPCr vs. kO2Hb. B, kPCr vs. Fp × D*. C, VPCr vs. kO2Hb. D, VPCr vs. Fp × D*. Data are displayed per coil element as the average over all volunteers in means ± SD.

Similar articles

Cited by

References

    1. Arnold DL, Taylor DJ & Radda GK (1985). Investigation of human mitochondrial myopathies by phosphorus magnetic resonance spectroscopy. Ann Neurol 18, 189–196. - PubMed
    1. Baguet A, Everaert I, Hespel P, Petrovic M, Achten E & Derave W (2011). A new method for non‐invasive estimation of human muscle fiber type composition. PLoS One 6, e21956. - PMC - PubMed
    1. Bendahan D, Confort‐Gouny S, Kozak‐Reiss G & Cozzone PJ (1990). Heterogeneity of metabolic response to muscular exercise in humans. New criteria of invariance defined by in vivo phosphorus‐31 NMR spectroscopy. FEBS Lett 272, 155–158. - PubMed
    1. Le Bihan D, Breton E, Lallemand D, Aubin ML, Vignaud J & Laval‐Jeantet M (1988). Separation of diffusion and perfusion in intravoxel incoherent motion MR imaging. Radiology 168, 497–505. - PubMed
    1. Boss A, Heskamp L, Breukels V, Bains LJ, van Uden MJ & Heerschap A (2018). Oxidative capacity varies along the length of healthy human tibialis anterior. J Physiol 596, 1467–1483. - PMC - PubMed

Publication types