. 2020 Dec 28;16(12):e1008771.
doi: 10.1371/journal.ppat.1008771. eCollection 2020 Dec.

Toxoplasma gondii PPM3C, a secreted protein phosphatase, affects parasitophorous vacuole effector export

Affiliations

Toxoplasma gondii PPM3C, a secreted protein phosphatase, affects parasitophorous vacuole effector export

Joshua Mayoral et al. PLoS Pathog. .

Abstract

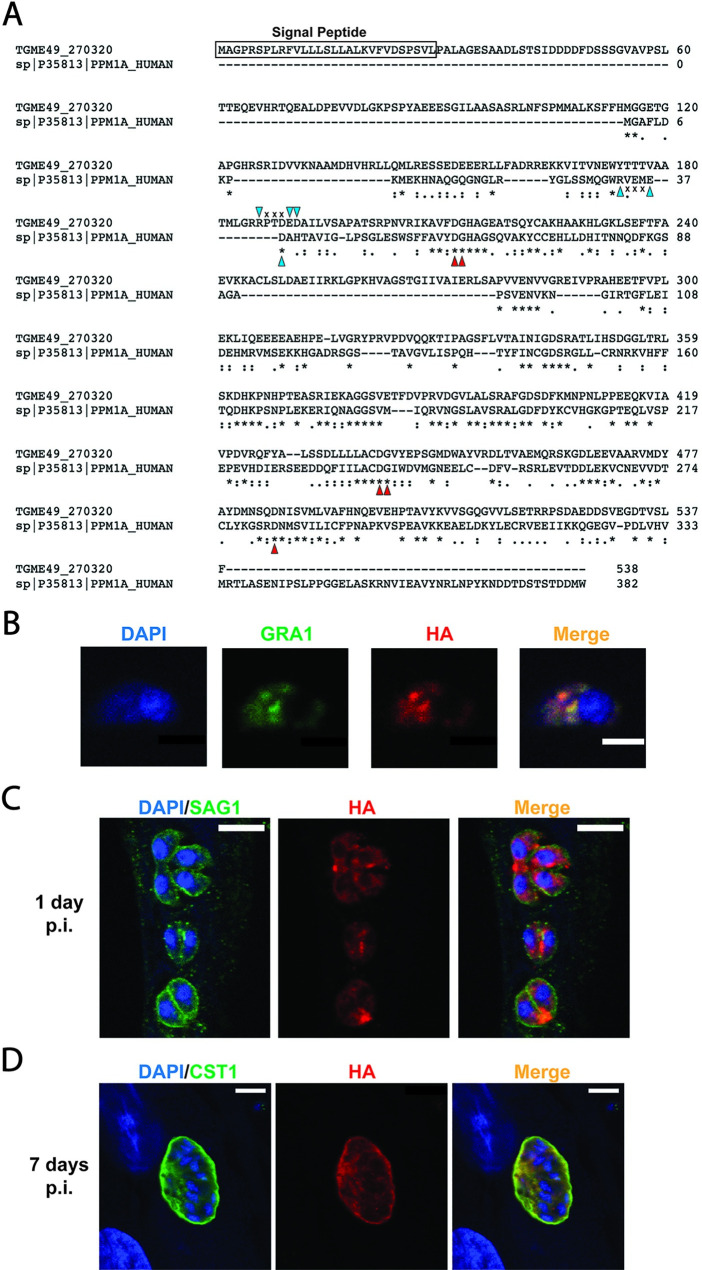
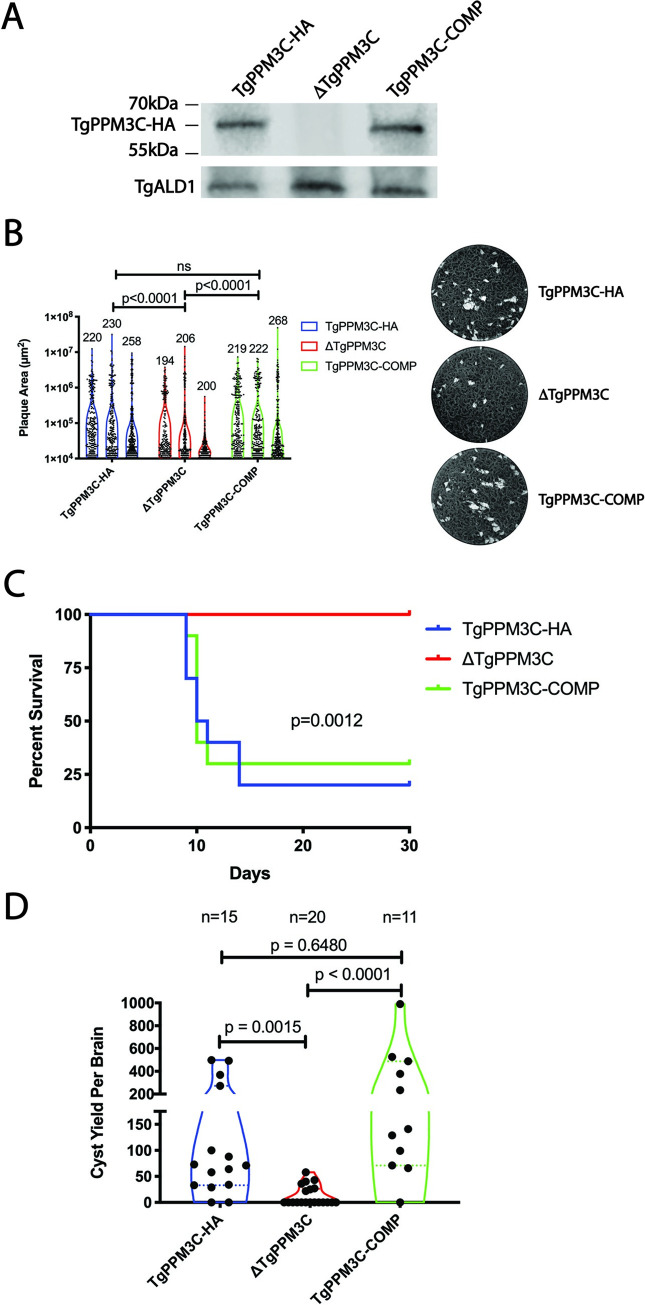
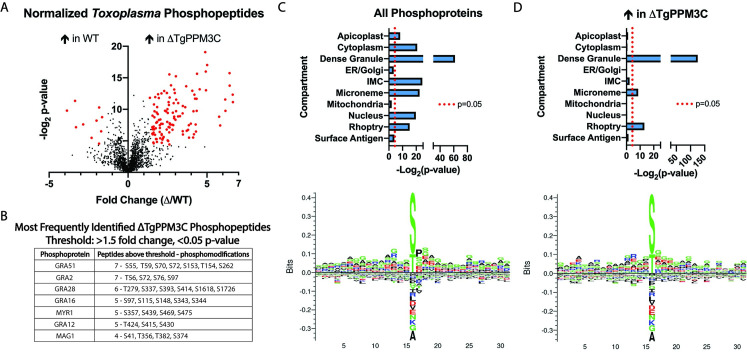
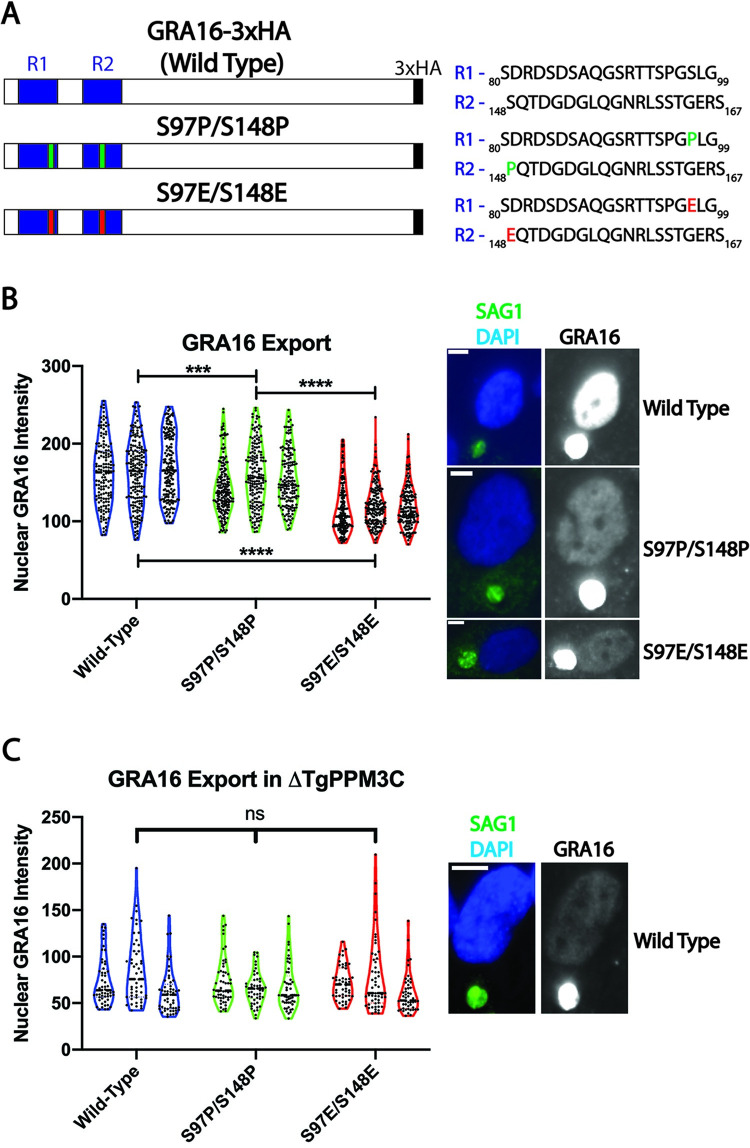
The intracellular parasite Toxoplasma gondii infects a large proportion of humans worldwide and can cause adverse complications in the settings of immune-compromise and pregnancy. T. gondii thrives within many different cell types due in part to its residence within a specialized and heavily modified compartment in which the parasite divides, termed the parasitophorous vacuole. Within this vacuole, numerous proteins optimize intracellular survival following their secretion by the parasite. We investigated the contribution of one of these proteins, TgPPM3C, predicted to contain a PP2C-class serine/threonine phosphatase domain and previously shown to interact with the protein MYR1, an essential component of a putative vacuolar translocon that mediates effector export into the host cell. Parasites lacking the TgPPM3C gene exhibit a minor growth defect in vitro, are avirulent during acute infection in mice, and form fewer cysts in mouse brain during chronic infection. Phosphoproteomic assessment of TgPPM3C deleted parasite cultures demonstrated alterations in the phosphorylation status of many secreted vacuolar proteins including two exported effector proteins, GRA16 and GRA28, as well as MYR1. Parasites lacking TgPPM3C are defective in GRA16 and GRA28 export, but not in the export of other MYR1-dependant effectors. Phosphomimetic mutation of two GRA16 serine residues results in export defects, suggesting that de-phosphorylation is a critical step in the process of GRA16 export. These findings provide another example of the emerging role of phosphatases in regulating the complex environment of the T. gondii parasitophorous vacuole and influencing the export of specific effector proteins from the vacuolar lumen into the host cell.


Conflict of interest statement

The authors have declared that no competing interests exist.

Figures

Fig 1
Fig 1. TgPPM3C is a parasitophorous vacuole protein with a PP2C-class phosphatase catalytic domain.
(A) Amino acid sequence alignment of TgPPM3C (Gene ID: TGME49_270320) and human protein phosphatase 1a (PPM1a), a canonical PP2C class phosphatase, performed with Clustal Omega [58]. TgPPM3C contains a predicted signal peptide (boxed region) and an extended N-terminal domain upstream of the conserved PP2C catalytic domain. Residues important for metal binding are indicated with red arrows. Unaligned but conserved residues important for phosphate and metal binding shared by TgPPM3C and PPM1A are indicated by blue arrows. (B) Immunofluorescence image of an extracellular parasite with labeled dense granules (GRA1), endogenously tagged TgPPM3C-HA (HA), and nucleus (DAPI). Partial colocalization is observed between GRA1 and HA, indicating TgPPM3C-HA is potentially packaged into dense granules. Scale bar equals 5μm. (C, D) Immunofluorescence image of parasitophorous vacuoles grown under tachyzoite growth conditions (24 hours post-infection) or bradyzoite growth conditions (D, 7 days post-infection). Parasites in (C) are labeled with SAG1, while bradyzoite differentiation in (D) was probed by glycosylated CST1 expression, detected with SalmonE monoclonal antibody. Vacuolar TgPPM3C is observed more prominently after prolonged culture and parasite development (as in D). Scale bars indicate 10μm.
Fig 2
Fig 2. ΔTgPPM3C parasites exhibit growth defects in vitro and in vivo.
(A) Immunoblot images obtained from SDS-PAGE separated protein lysates of tachyzoite infected cultures, 24 hours post-infection. Comparable amounts of TgPPM3C protein, migrating close to the predicted size (59kDa), are expressed in TgPPM3C-HA and TgPPM3C-COMP infected cultures but not in ΔTgPPM3C infected cultures. TgALD1 was used as a parasite specific loading control. (B) Violin plots depicting the distribution of plaque sizes formed by TgPPM3C modified strains after two weeks of growth in human fibroblast monolayers. Representative images of wells containing plaques from each strain are shown to the right. Violin plots represent three independent experiments for each strain. The number of plaques formed by each strain across multiple wells for a given experiment are indicated above each violin plot. Plaque size was quantified in ImageJ, using the Kruskal-Wallis and Dunn’s multiple comparisons test to compare each group and generate p values. A significant decrease in plaque size is observed in the ΔTgPPM3C strain compared to TgPPM3C-HA and TgPPM3C-COMP strains. (C) Kaplan-Meier survival curves from C57Bl/6 mice injected intraperitoneally with equal amounts of parasites (16,000) from each strain. 10 mice were injected per group. 20% and 30% of mice survived after 30 days following infection with TgPPM3C-HA and TgPPM3C-COMP parasites respectively, whereas all mice survived following infection with ΔTgPPM3C parasites, indicating ΔTgPPM3C parasites are attenuated. A log-rank test indicates a significant difference in survival curves between groups. Data are representative of two independent experiments. (D) Violin plots of cyst burden from individual C57Bl/6 mouse brains, harvested 30 days post-infection following intraperitoneal injection with 2,000 parasites of each strain. Cyst burden is estimated based on cyst counts from one cerebral hemisphere per mouse brain. The number of brains from which cysts were quantified are indicated above each plot. Significantly less cysts are formed by ΔTgPPM3C parasites compared to TgPPM3C-HA and TgPPM3C-COMP parasites. Data are pooled from two independent experiments.
Fig 3
Fig 3. Phosphoproteomic analysis of TgPPM3C-HA (WT) and ΔTgPPM3C infected cultures identifies phosphopeptides that are more abundant in ΔTgPPM3C cultures.
(A) Volcano plot depicting significant fold changes in Toxoplasma phosphopeptides from ΔTgPPM3C samples compared to TgPPM3C-HA (WT) samples. Phosphopeptides with fold changes greater than 1.5 or less than -1.5 and with -log2 p-values greater than 4.32 (equivalent to p < 0.05) are highlighted in red. Using this criteria, 118 phosphopeptides are more abundant in ΔTgPPM3C cultures, as opposed to 10 phosphopeptides more abundant in WT cultures, suggesting that the absence of TgPPM3C predominately results in the accumulation of phosphoproteins that are normally dephosphorylated by TgPPM3C. Phosphopeptides are normalized to their respective protein abundance, detected in the flow-through fraction of titanium dioxide beads used for phosphopeptide enrichment. See Dataset S2 for specific phosphopeptide fold changes and p-values.(B) Phosphoproteins detected in this dataset with the most phosphopeptides above a 1.5 fold change and p < 0.05 threshold. Notably, two exported effectors (GRA16 and GRA28) and a protein involved in facilitating effector export (MYR1) are among these proteins. (C) Top–Results from hypergeometric testing to identify significant enrichment for subcellular parasite compartments among all phosphopeptides detected from wild-type and ΔTgPPM3C samples, compared to the entire Toxoplasma proteome. Various compartments are significantly enriched. Bottom–Amino acid motif, generated by Seq2Logo [57], derived from randomly selected phosphopeptides identified in wild-type and ΔTgPPM3C samples using a -15 and + 15 amino acid window with respect to a phosphoserine or phosphothreonine residue. As expected, no clear consensus motifs are evident. (D) As described in (C), except that hypergeometric testing (top) and amino acid motif generation (bottom) was performed solely with phosphopeptides identified as significantly enriched in ΔTgPPM3C samples. A clear enrichment for the dense granule compartment and to a lesser extent rhoptry and microneme compartments are observed among these phosphopeptides, although no consensus amino acid motif is evident.
Fig 4
Fig 4. ΔTgPPM3C parasites exhibit partial defects in protein effector export.
(A) Violin plots of GRA16-3xHA, GRA24-3xHA, GRA28-3xHA, and TgIST-3xHA accumulation in host nuclei infected with either PruQ or ΔTgPPM3C parasites, transiently transfected with epitope tagged effector constructs and allowed to infect HFF monolayers for 24 hours. Effector protein fluorescence was quantified from fibroblast nuclei containing a single HA-positive parasite vacuole. Violin plots of uninfected host nuclei in the same monolayer are provided to demonstrate background. A significant decrease in GRA16 and GRA28, but not GRA24 and TgIST, host nuclear accumulation is observed during ΔTgPPM3C infection, likely indicating defects in effector export from the parasitophorous vacuole. Violin plots represent three independent experiments. Representative images from which effector intensity was quantified are shown on the right. Antibody to SAG1 was used as a parasite marker, DAPI as a host nucleus marker, and anti-HA antibody was used to detect epitope tagged effectors. The white asterisks indicate uninfected fibroblast nuclei. (B) Violin plots of c-Myc induction in host nuclei infected with either PruQ, ΔTgPPM3C, or TgPPM3C-COMP parasites for 24 hours. Host c-Myc fluorescence was quantified from fibroblast nuclei containing a single parasite vacuole. A significant decrease in host c-Myc induction is observed during ΔTgPPM3C infection compared to PruQ and TgPPM3C-COMP infections. Notably, significant induction of host c-Myc expression over uninfected host cells are observed during infection with all three strains (asterisks above each plot). Violin plots represent three independent experiments. Representative images from which c-Myc intensity were quantified are shown on the right. Antibody to SAG1 was used as a parasite marker and DAPI as a host nucleus marker. Violin plots of uninfected host nuclei in the same monolayer are provided to demonstrate background. The white asterisk indicates an uninfected fibroblast nucleus. Non-specific labeling of parasite vacuoles can be observed with the c-Myc antibody used to label host cells. (C) Violin plots of IRF1 induction in host nuclei infected with either PruQ, ΔTgPPM3C, or TgPPM3C-COMP parasites and stimulated with IFN-γ for six hours prior to fixation at 24 hours post-infection. Host IRF1 fluorescence was quantified from fibroblast nuclei containing a single parasite vacuole. Although each strain significantly attenuated IRF1 induction compared to uninfected cells (asterisks above each plot), no significant differences in the extent of IRF1 suppression are observed between any of the strains. Violin plots of uninfected host nuclei in the same monolayer are provided to demonstrate background. Violin plots represent three independent experiments. A representative image from a PruQ infected fibroblast and uninfected fibroblast (white asterisk) is shown beside the violin plots. Antibody to SAG1 was used as a parasite marker and DAPI as a host nucleus marker. (D) Violin plots of EZH2 induction in host nuclei infected with either TgPPM3C-HA, ΔTgPPM3C, or TgPPM3C-COMP parasites for 24 hours. Host EZH2 fluorescence was quantified from fibroblast nuclei containing a single parasite vacuole. Each strain significantly induces host EZH2 compared to uninfected cells (asterisks), although no significant differences in host EZH2 induction were observed between any of the strains. Violin plots of uninfected host nuclei in the same monolayer are provided to demonstrate background. Violin plots represent three independent experiments. A representative image from a TgPPM3C-HA infected fibroblast and uninfected fibroblast (white asterisk) is shown beside the violin plots. Antibody to IMC3 was used as a parasite marker and DAPI as a host nucleus marker. The white asterisk indicates an uninfected fibroblast nucleus. Non-specific parasite labeling is evident with the EZH2 antibody used to label host cells. For all violin plots in this figure, **** asterisks indicate p < 0.0001 and ns indicates no significant difference. Kruskal-Wallis and Dunn’s multiple comparisons tests were performed to calculate p-values. All scale bars in this figure indicate 10μm.
Fig 5
Fig 5. Phosphomimetic mutations impair the export of GRA16 from the parasitophorous vacuole.
(A) Schematic of GRA16-3xHA constructs, including the partial sequence and location of previously described tandem repeat regions (R1 and R2). Mutations were designed to introduce either proline (S97P/S148P) or glutamate (S97E/S148E) in place of serine 97 and serine 148. (B) Violin plots and representative images of GRA16 intensity in host nuclei infected with parasites expressing either wild type, S97P/S148P, or S97E/S148E GRA16-3xHA constructs. Nuclear GRA16 intensity was quantified from fibroblast nuclei containing a single HA-positive parasite vacuole. A significant decrease in nuclear S97P/S148P and S97E/S148E GRA16 intensity is observed compared to wild type GRA16 intensity, while S97E/S148E GRA16 nuclear intensity values were also found to be significantly less intense compared to values recorded from S97P/S148P infections. Violin plots represent three independent experiments. Representative images from which GRA16 intensities were quantified are shown to the right. Antibody to SAG1 was used as a parasite marker and DAPI as a host nucleus marker. *** asterisks indicate p < 0.001, **** indicates p < 0.0001. Kruskal-Wallis and Dunn’s multiple comparisons tests were performed to calculate p-values. Scale bars indicate 5μm in B and 10μm in C. (C) Violin plots and representative images of GRA16 intensity in host nuclei as described in (B), except that all experiments were conducted in the ΔTgPPM3C strain. No significant differences in host nuclear intensity are observed between any of the GRA16 constructs during ΔTgPPM3C infection, suggesting that wild type and mutagenized GRA16 have seemingly similar stabilities during parasite infection.

Similar articles

Cited by

References

    1. Montoya JG, Liesenfeld O. Toxoplasmosis. Lancet. 2004;363(9425):1965–76. 10.1016/S0140-6736(04)16412-X . - DOI - PubMed
    1. Robert-Gangneux F, Darde ML. Epidemiology of and diagnostic strategies for toxoplasmosis. Clin Microbiol Rev. 2012;25(2):264–96. Epub 2012/04/12. 10.1128/CMR.05013-11 - DOI - PMC - PubMed
    1. Derouin F, Garin YJ. Toxoplasma gondii: blood and tissue kinetics during acute and chronic infections in mice. Exp Parasitol. 1991;73(4):460–8. Epub 1991/11/01. 10.1016/0014-4894(91)90070-d . - DOI - PubMed
    1. Ferguson DJ. Use of molecular and ultrastructural markers to evaluate stage conversion of Toxoplasma gondii in both the intermediate and definitive host. Int J Parasitol. 2004;34(3):347–60. 10.1016/j.ijpara.2003.11.024 . - DOI - PubMed
    1. Wohlfert EA, Blader IJ, Wilson EH. Brains and Brawn: Toxoplasma Infections of the Central Nervous System and Skeletal Muscle. Trends Parasitol. 2017;33(7):519–31. Epub 2017/05/10. 10.1016/j.pt.2017.04.001 - DOI - PMC - PubMed

Publication types

Substances